Free Access
Fig. 7
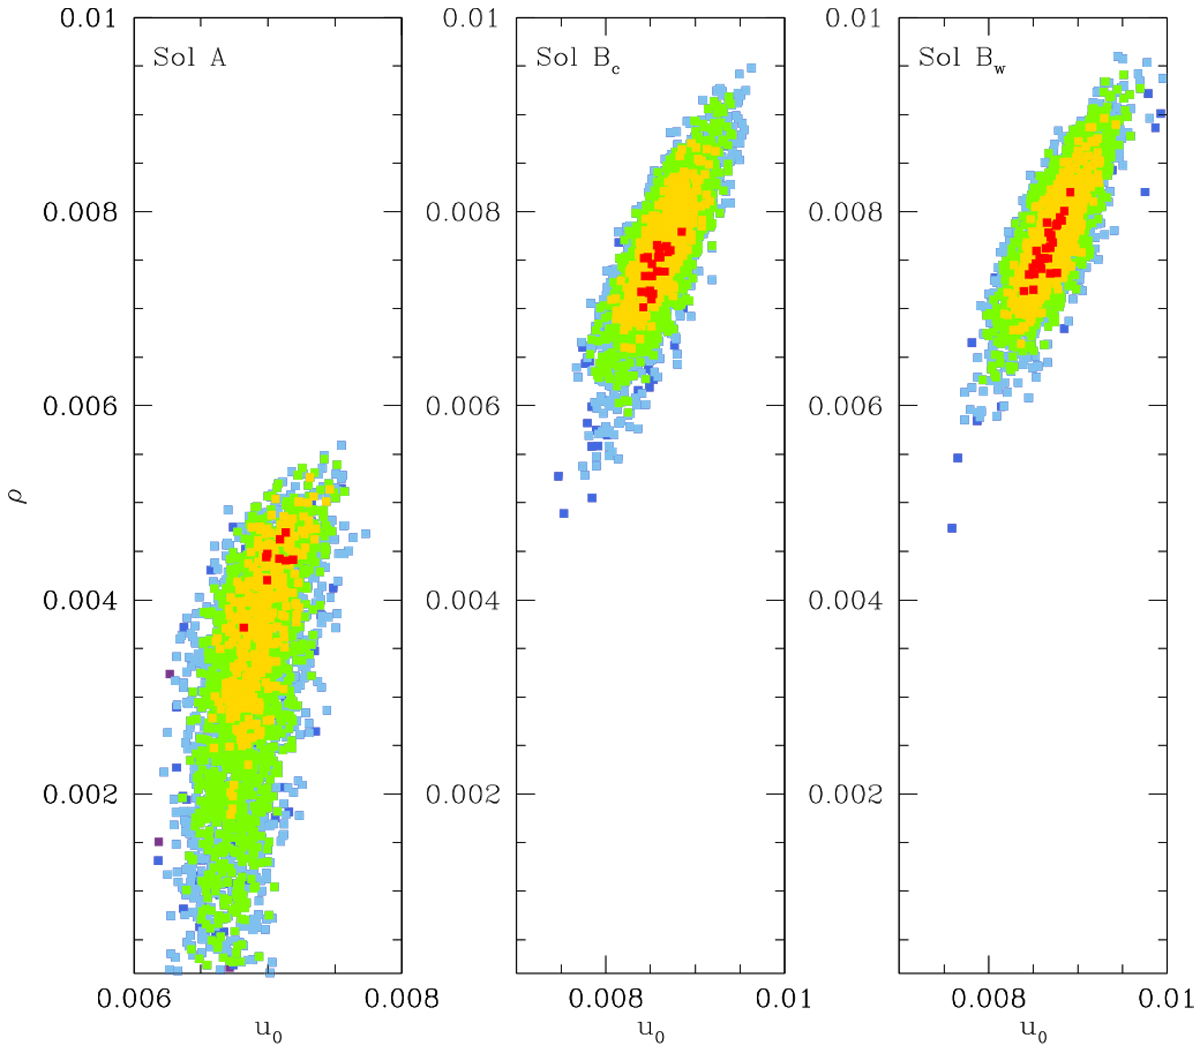
Distributions of points in the MCMC chains for the three degenerate 2L1S solutions. The red, yellow, green, cyan, and blue colors represent points within 1σ, 2σ, 3σ, 4σ, and 5σ, respectively. The significance level was determined so that nσ corresponds to Δχ2 = n2 with rescaled uncertainties.
Current usage metrics show cumulative count of Article Views (full-text article views including HTML views, PDF and ePub downloads, according to the available data) and Abstracts Views on Vision4Press platform.
Data correspond to usage on the plateform after 2015. The current usage metrics is available 48-96 hours after online publication and is updated daily on week days.
Initial download of the metrics may take a while.