Free Access
Fig. 6
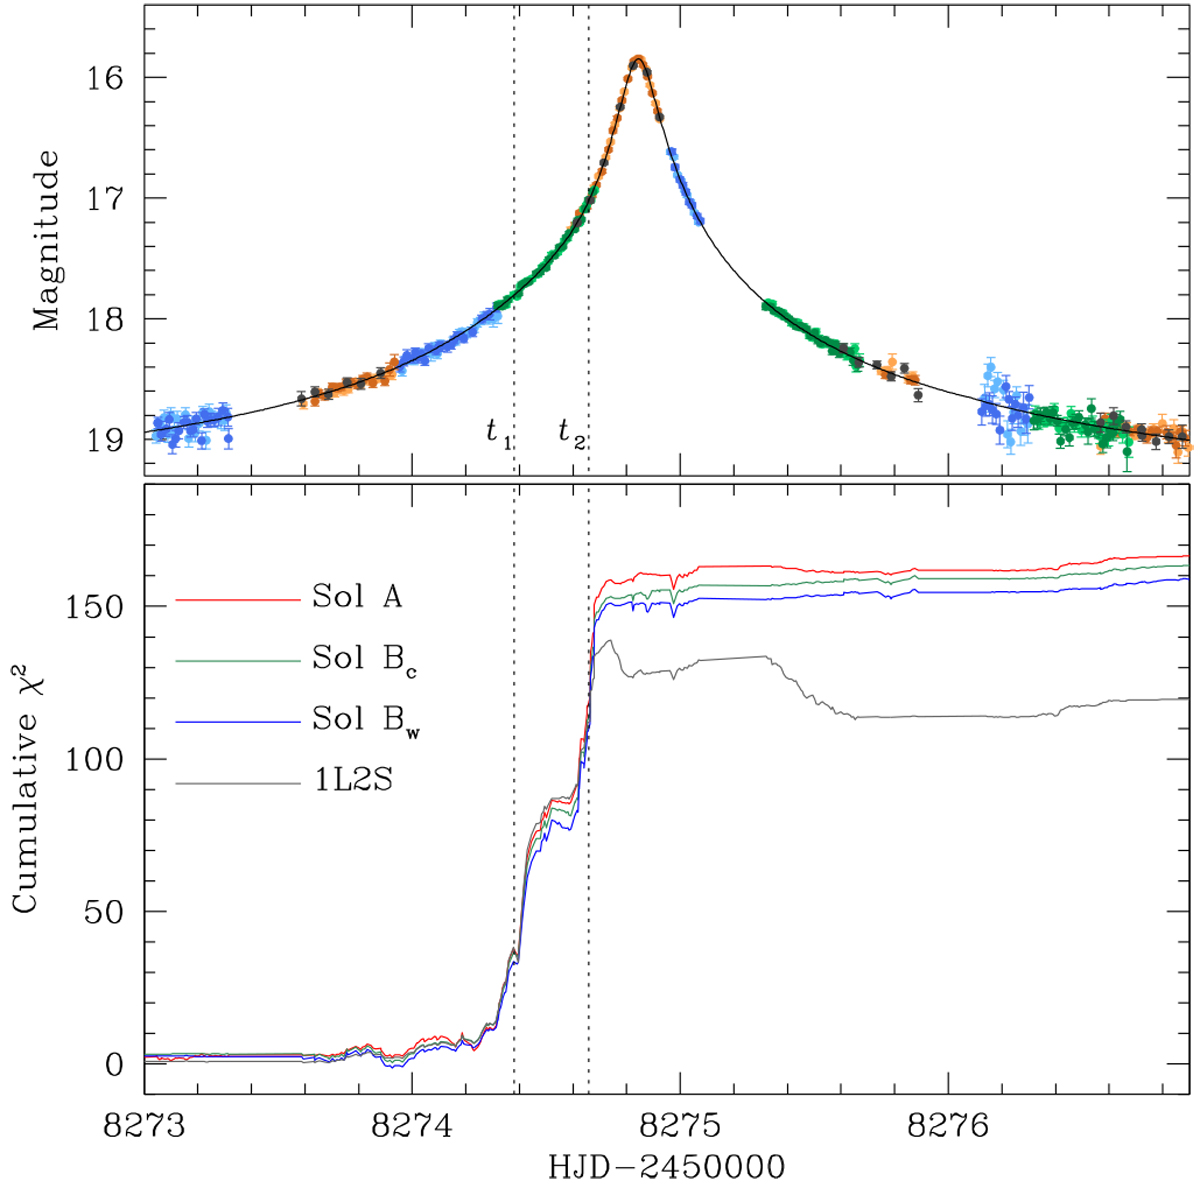
Cumulative distributions of Δχ2 for the three degenerate 2L1S (solutions A, Bc, and Bw) models and 1L2S model with respect to the 1L1S model. The dotted vertical lines denote the times of the major anomalies at t1 and t2 that are marked in Fig. 1.
Current usage metrics show cumulative count of Article Views (full-text article views including HTML views, PDF and ePub downloads, according to the available data) and Abstracts Views on Vision4Press platform.
Data correspond to usage on the plateform after 2015. The current usage metrics is available 48-96 hours after online publication and is updated daily on week days.
Initial download of the metrics may take a while.