Fig. 5
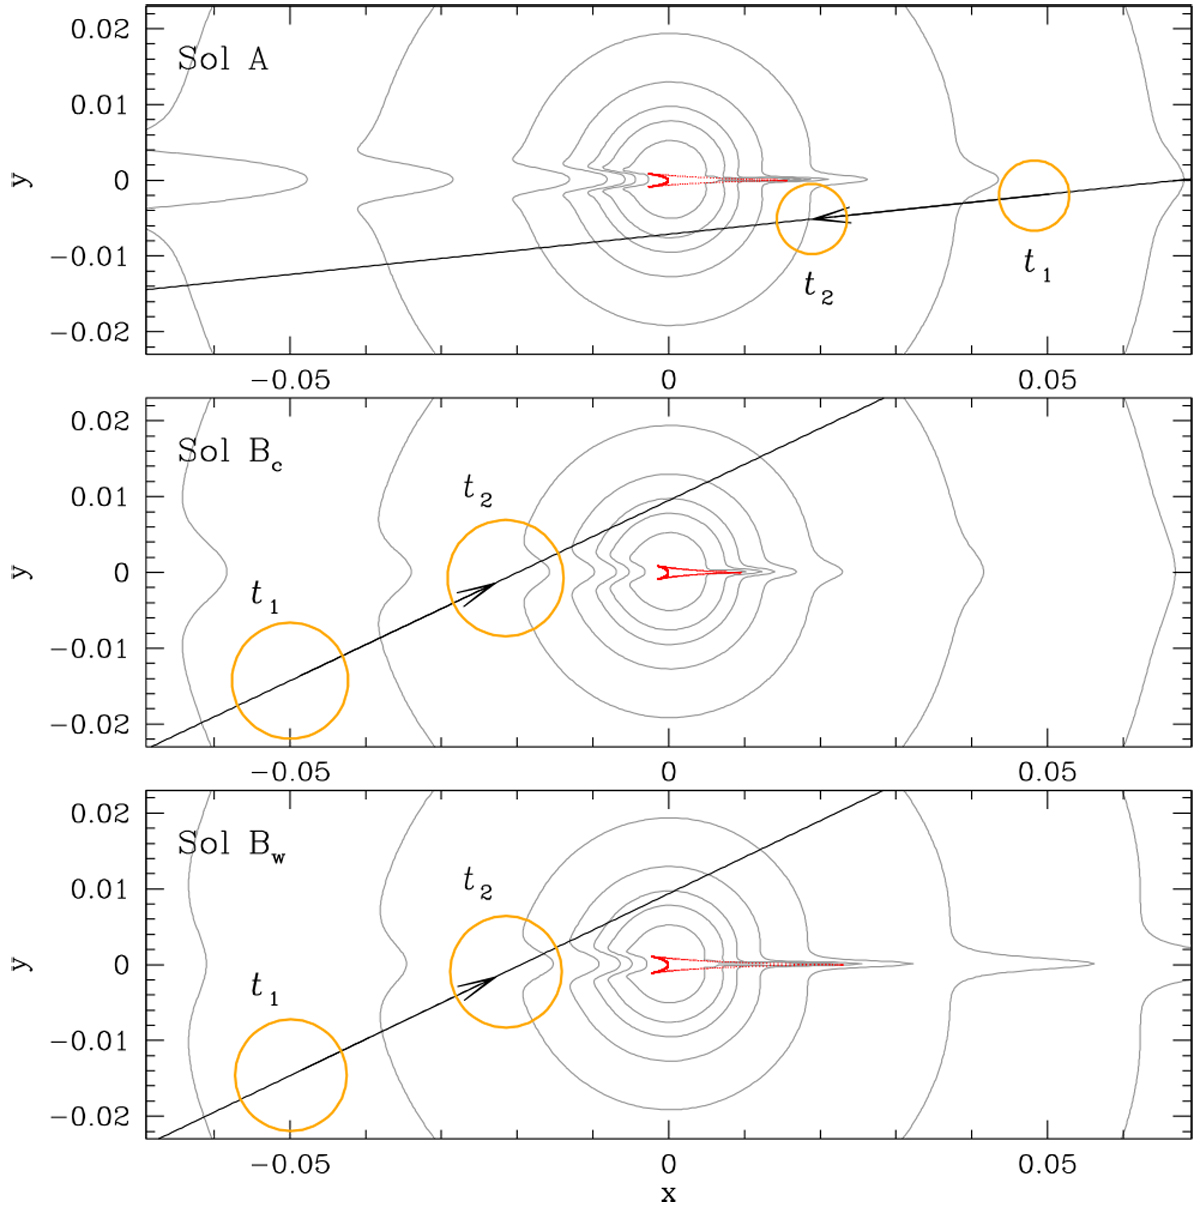
Lens system configurations in the central magnification region for the three 2L1S solutions. Notations are the same as those in Fig. 4. The two orange circles represent the source positions at the times of the major anomalies at t1 and t2 that are marked in Figs. 1 and 3. The size of the circle is scaled to the source size. In the case of solution A, for which the source size cannot be securely measured, the radius of the circle is set to that of the best-fit value.
Current usage metrics show cumulative count of Article Views (full-text article views including HTML views, PDF and ePub downloads, according to the available data) and Abstracts Views on Vision4Press platform.
Data correspond to usage on the plateform after 2015. The current usage metrics is available 48-96 hours after online publication and is updated daily on week days.
Initial download of the metrics may take a while.