Fig. 3
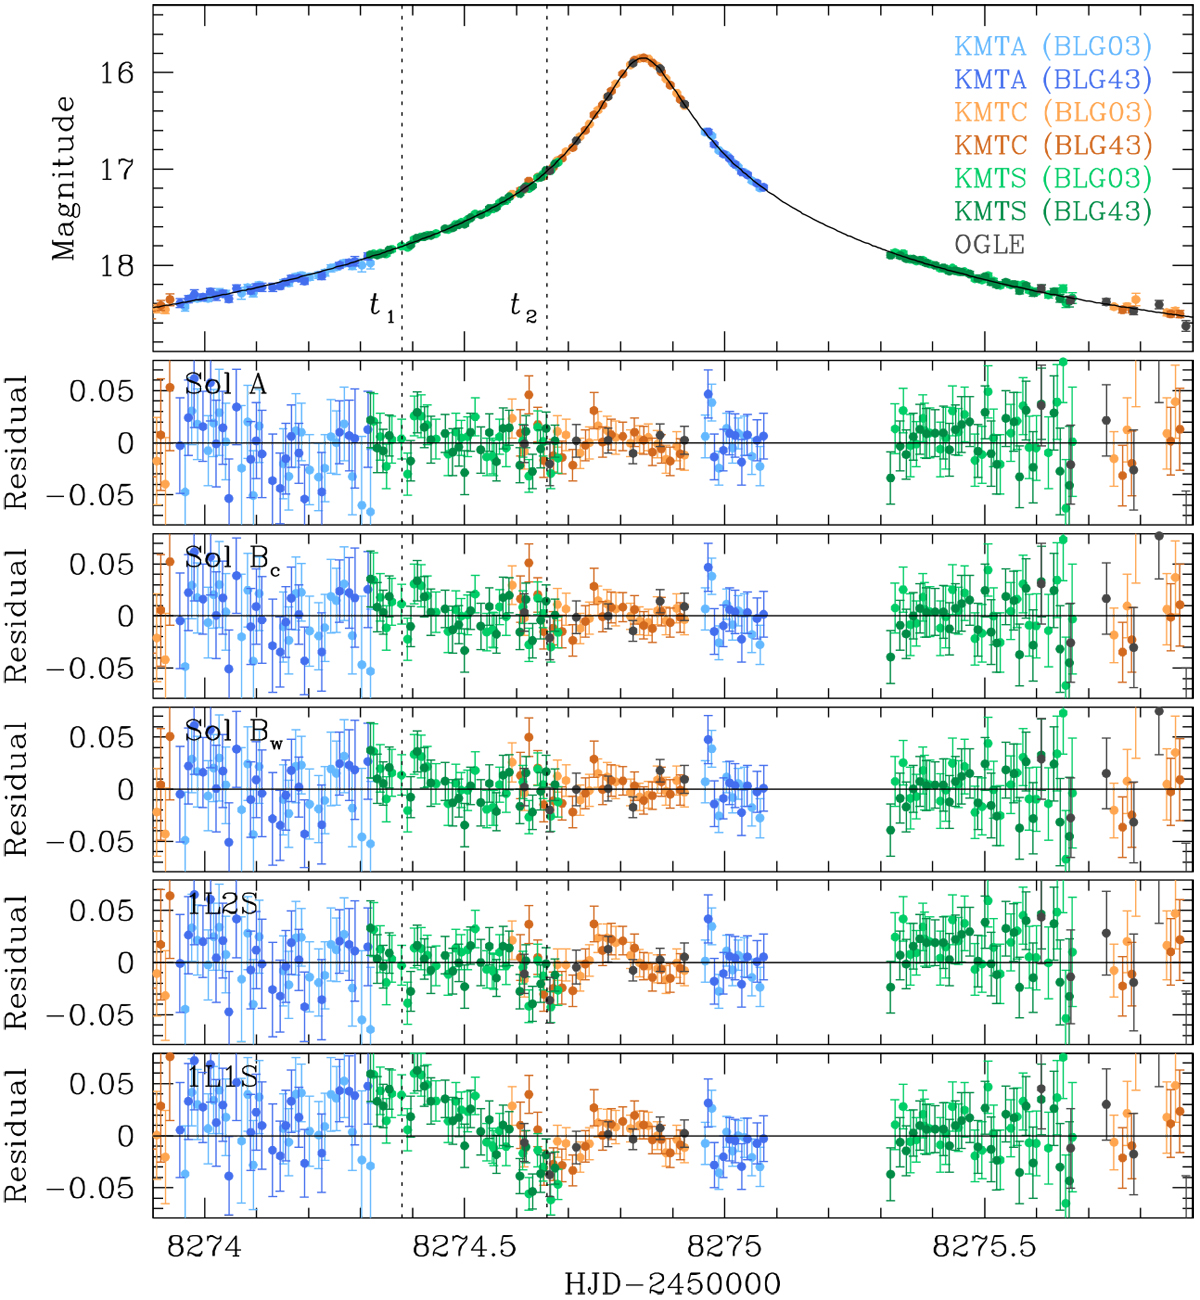
Zoomed-in view of the light curve in the peak region and the residuals from five tested models including 1L1S, 1L2S, and three 2L1S models (solutions A, Bc, and Bw). Although three 2L1S model curves are drawn over the data points in the top panel, it is difficult to distinguish between them withinthe line width due to the severity of the degeneracy among the solutions.
Current usage metrics show cumulative count of Article Views (full-text article views including HTML views, PDF and ePub downloads, according to the available data) and Abstracts Views on Vision4Press platform.
Data correspond to usage on the plateform after 2015. The current usage metrics is available 48-96 hours after online publication and is updated daily on week days.
Initial download of the metrics may take a while.