Fig. 1
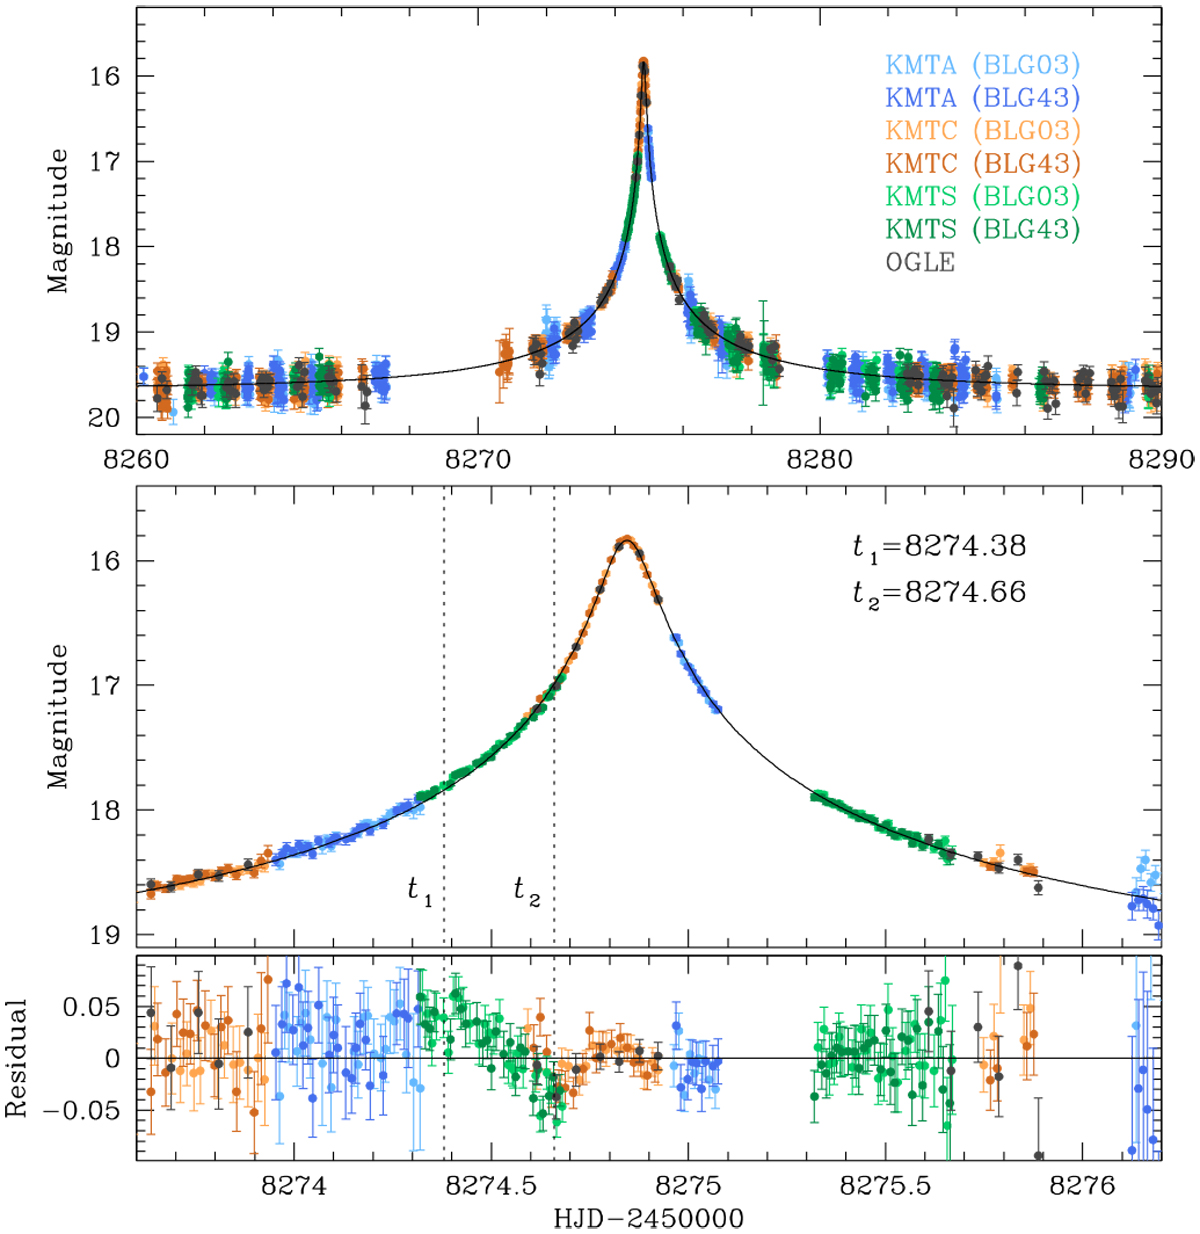
Light curve of KMT-2018-BLG-1025. Upper and lower panels: whole view and the zoomed-in view of the peak region, respectively. The colors of data points indicate the observatories, as given in the legend. The curve plotted over the data points is the 1L1S model, for which the residuals in the peak region are presented in the bottom panel. The dotted vertical lines at t1 ~ 8274.38 and t2 ~8274.66 indicate the respective times of the bump and dip in the residuals to the 1L1S model.
Current usage metrics show cumulative count of Article Views (full-text article views including HTML views, PDF and ePub downloads, according to the available data) and Abstracts Views on Vision4Press platform.
Data correspond to usage on the plateform after 2015. The current usage metrics is available 48-96 hours after online publication and is updated daily on week days.
Initial download of the metrics may take a while.