Free Access
Fig. 7
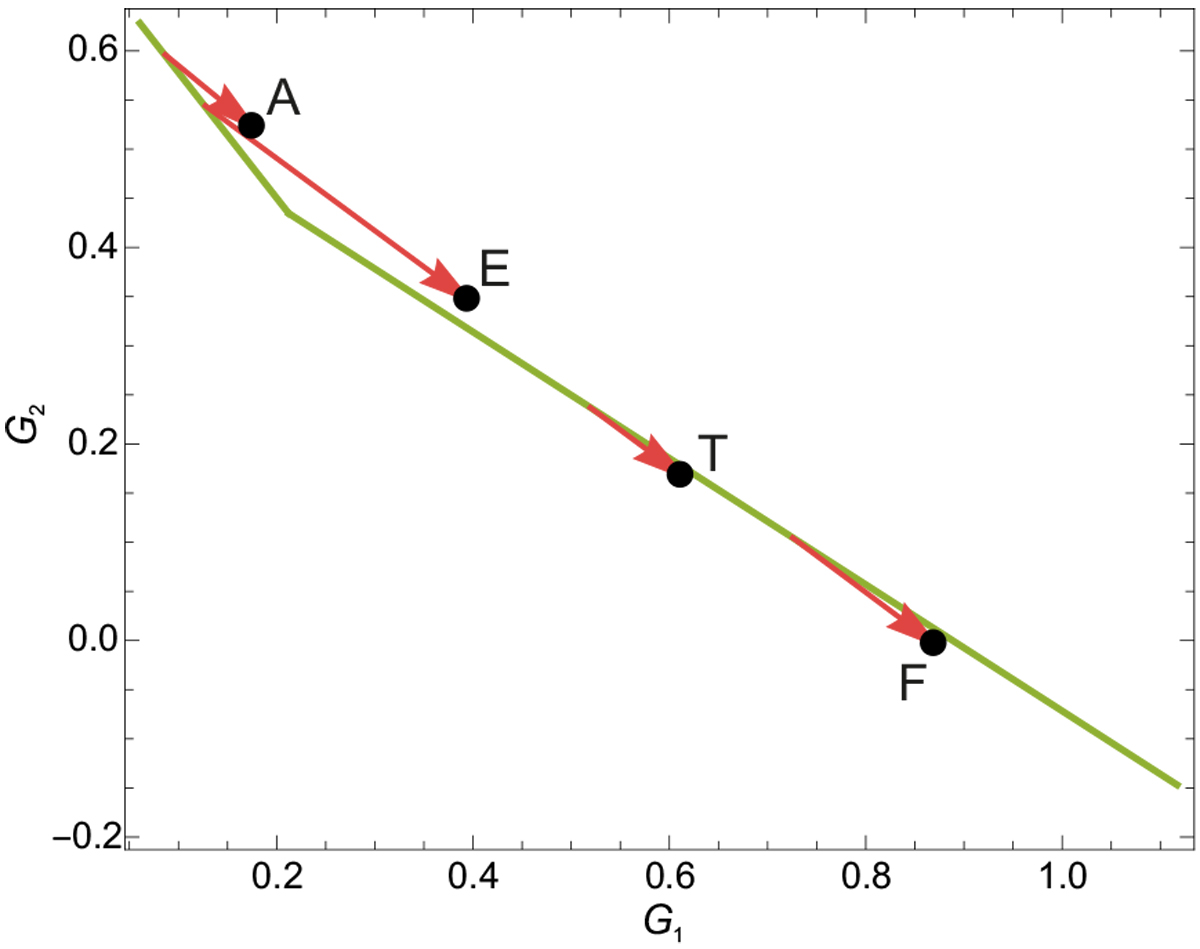
The average G1 and G2 parameters of a few Tholen classes (black dots). The green line shows how the G12 parameter maps into G1 and G2 in the H, G12 magnitude system and the red arrows show the shifts from the light curve maximum based G1 and G2 parameters.
Current usage metrics show cumulative count of Article Views (full-text article views including HTML views, PDF and ePub downloads, according to the available data) and Abstracts Views on Vision4Press platform.
Data correspond to usage on the plateform after 2015. The current usage metrics is available 48-96 hours after online publication and is updated daily on week days.
Initial download of the metrics may take a while.