Open Access
Fig. 7
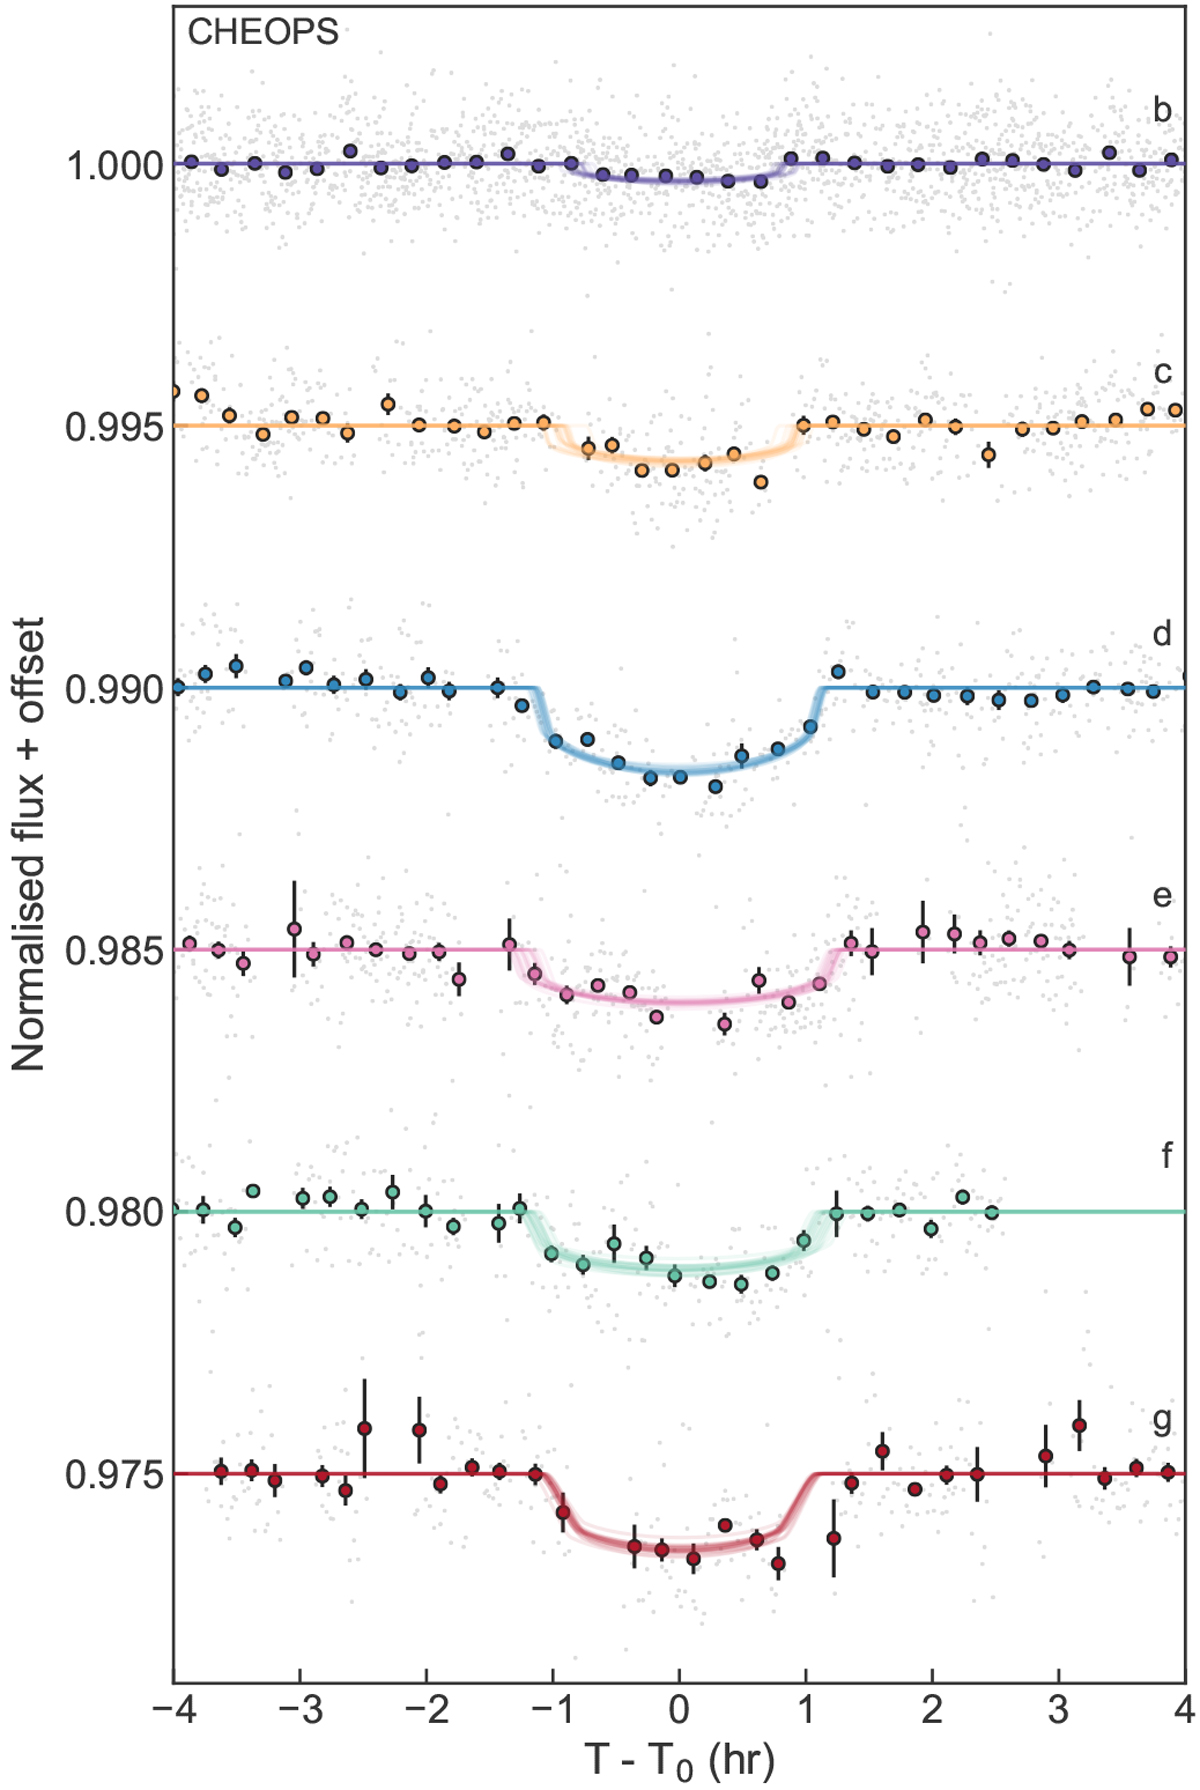
Detrended CHEOPS light curves phase-folded to the periods of each of the planets, with signals of the other planets removed. Unbinned data are shown with grey points, data in 15-min bins are shown with coloured circles, and samples drawn from the posterior distribution of the global fit are shown with coloured lines.
Current usage metrics show cumulative count of Article Views (full-text article views including HTML views, PDF and ePub downloads, according to the available data) and Abstracts Views on Vision4Press platform.
Data correspond to usage on the plateform after 2015. The current usage metrics is available 48-96 hours after online publication and is updated daily on week days.
Initial download of the metrics may take a while.