Fig. 6
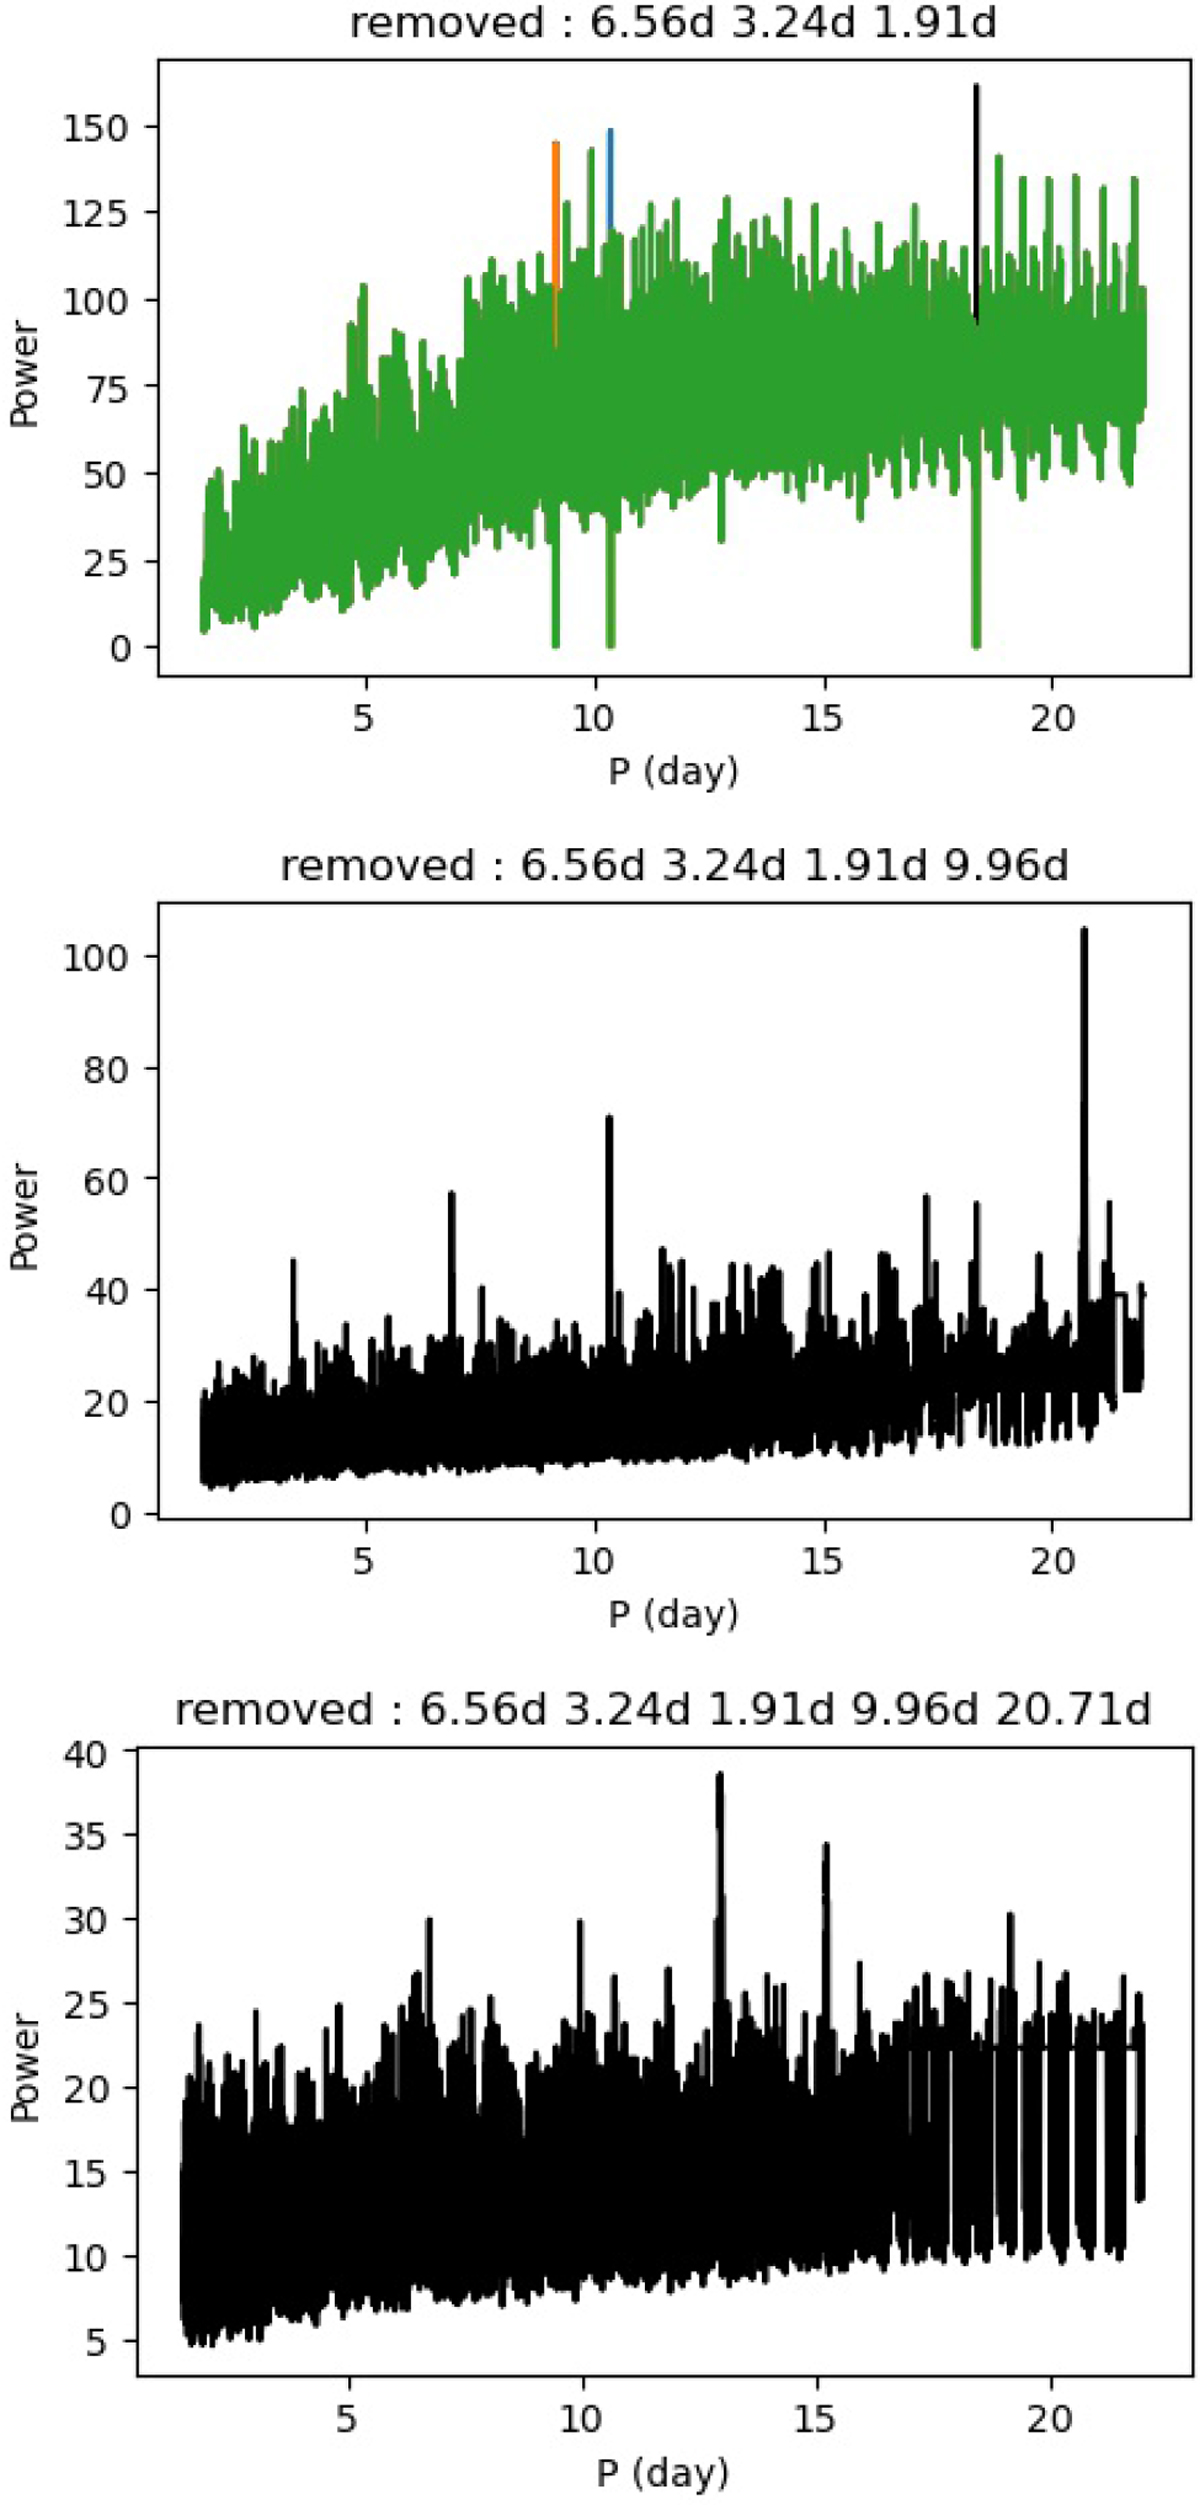
Successive use of the BLS algorithm to identify the new candidates. Top panel: green curve has its highest power at 9.96 d once the three highest peaks (i = 3) at 18.35 d (black), 10.37 d (blue), and 9.17 d (orange) are ignored. Middle panel: BLS after the removal of the 9.96 d signal in the light curve, with no peaks ignored (j = 0). Bottom panel: BLS after the removal of the 20.71 d signal as well.
Current usage metrics show cumulative count of Article Views (full-text article views including HTML views, PDF and ePub downloads, according to the available data) and Abstracts Views on Vision4Press platform.
Data correspond to usage on the plateform after 2015. The current usage metrics is available 48-96 hours after online publication and is updated daily on week days.
Initial download of the metrics may take a while.