Fig. 7.
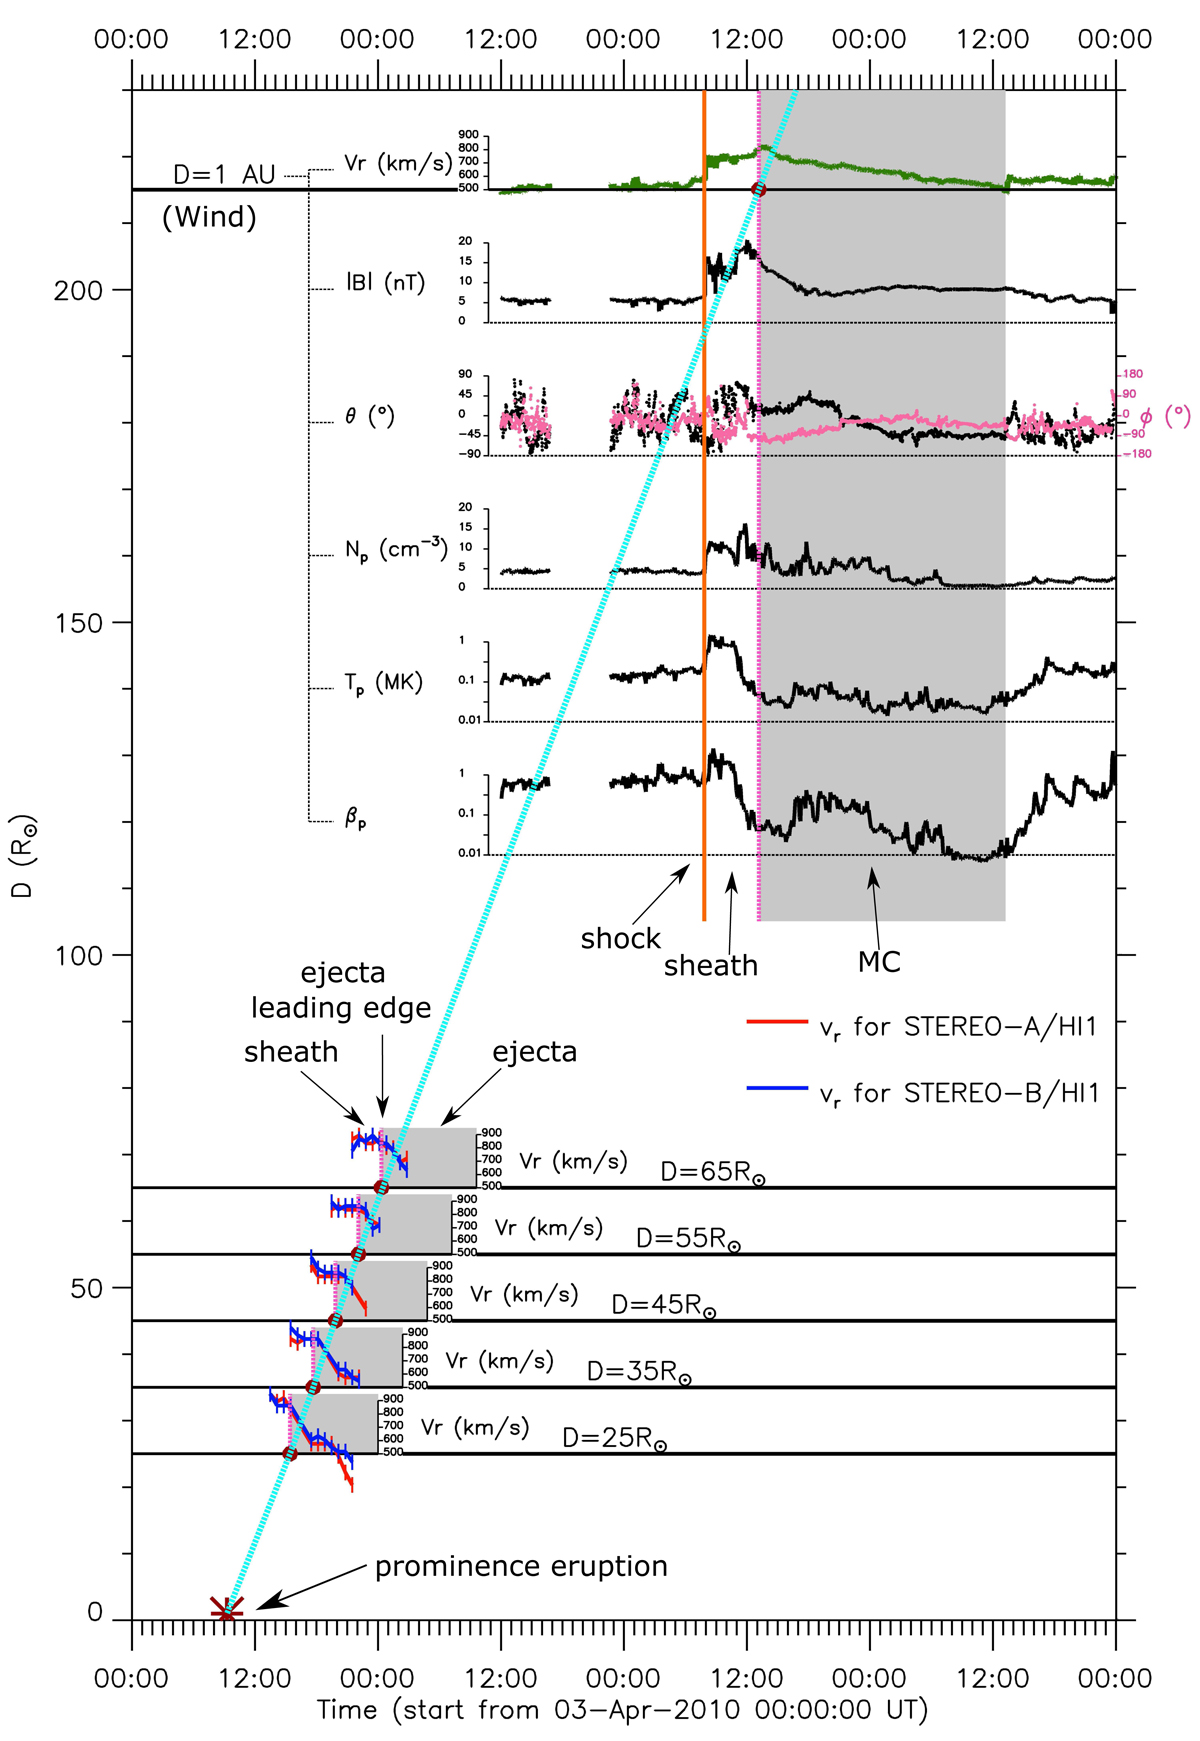
Temporal evolution of the radial velocity of the CME with the different heliocentric distances along the Sun-Earth line. The horizontal axes of all the small insets are the time marked by the main horizontal axis at the bottom. The red (blue) thick lines with error bars represent the reconstructed solar wind radial velocity at the distance of 25 R⊙, 35 R⊙, 45 R⊙, 55 R⊙, and 65 R⊙ for STEREO-A (B) based on the radial velocity map. The ejecta following its leading edge (vertical dashed lilac line) is marked as the shadow region. The brown asterisk above the main horizontal axis at the bottom represents the time of the prominence eruption associated with this CME. In the upper corner, the thick solid green line is the radial solar wind velocity observed by the Wind spacecraft at 1 AU. The vertical orange line and vertical dashed lilac line mark the arrivals of the shock and MC (in shadow), respectively (based on the list of interplanetary coronal mass ejections at http://space.ustc.edu.cn/dreams/wind_icmes/index.php, Chi et al. 2016). The magnetic field magnitude (|B|), elevation (θ), and azimuth (ϕ, in pink), the proton number density (Np), the proton temperature (Tp), and the plasma beta (βp) measured by Wind are also displayed for clarity. The oblique dashed blue polyline connects the leading edge of the ejecta in the HI1 FOV (solid brown circles at distances of 25 R⊙, 35 R⊙, 45 R⊙, 55 R⊙, and 65 R⊙) with the CME eruption time at the solar surface (brown asterisk) and the beginning time of magnetic cloud at 1 AU (solid brown circle at 1 AU).
Current usage metrics show cumulative count of Article Views (full-text article views including HTML views, PDF and ePub downloads, according to the available data) and Abstracts Views on Vision4Press platform.
Data correspond to usage on the plateform after 2015. The current usage metrics is available 48-96 hours after online publication and is updated daily on week days.
Initial download of the metrics may take a while.