Fig. 6.
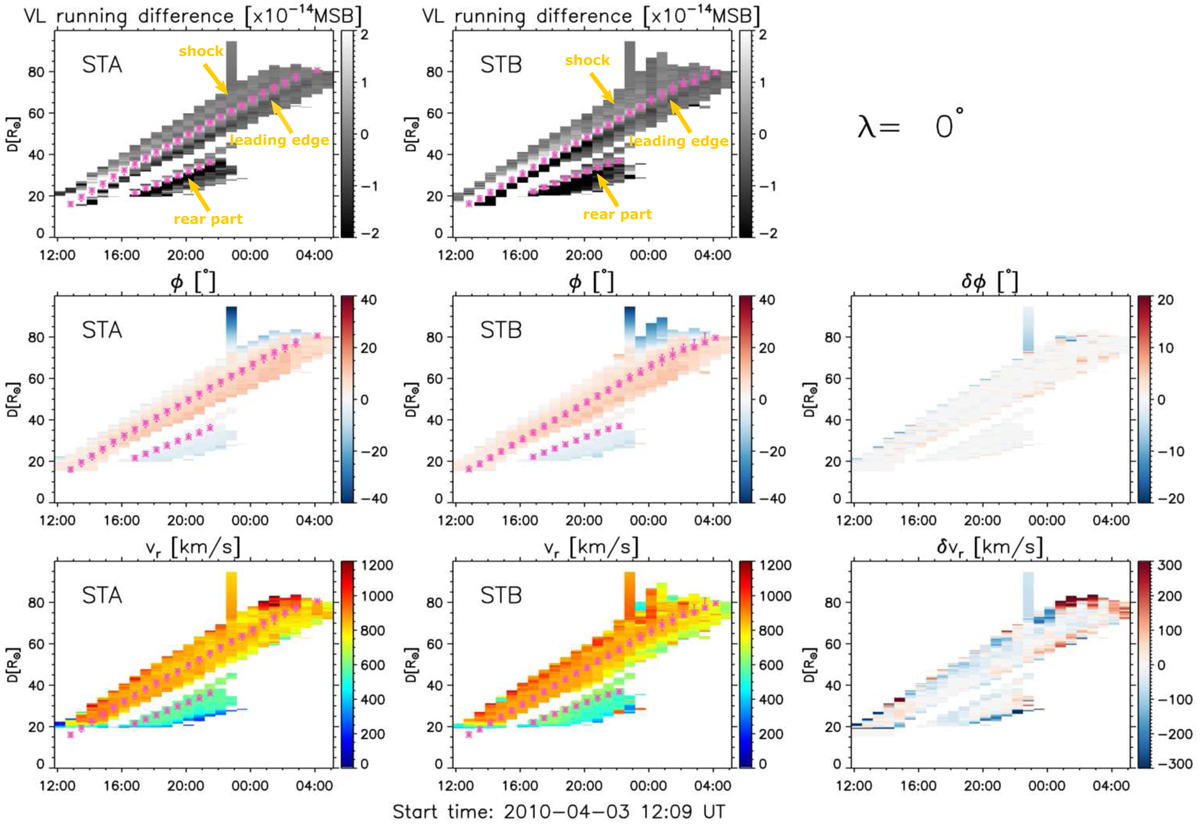
Time-distance evolution of the CME on 3 April 2010 in the ecliptic plane (λ = 0°) derived from the 3D pp maps and radial velocity maps. Top, middle, and bottom rows: time-distance plot of the brightness of STEREO/HI1 running-difference image, HEE longitude (ϕ), and radial velocity (vr), respectively. Left, middle, and right columns: corresponding values of STEREO-A, STEREO-B, and their difference (A–B), respectively. The lilac asterisks with error bars mark the position of the ejecta leading part and rear part, identified by the peak of bright edges in the front and the back of the ejecta.
Current usage metrics show cumulative count of Article Views (full-text article views including HTML views, PDF and ePub downloads, according to the available data) and Abstracts Views on Vision4Press platform.
Data correspond to usage on the plateform after 2015. The current usage metrics is available 48-96 hours after online publication and is updated daily on week days.
Initial download of the metrics may take a while.