Fig. 5.
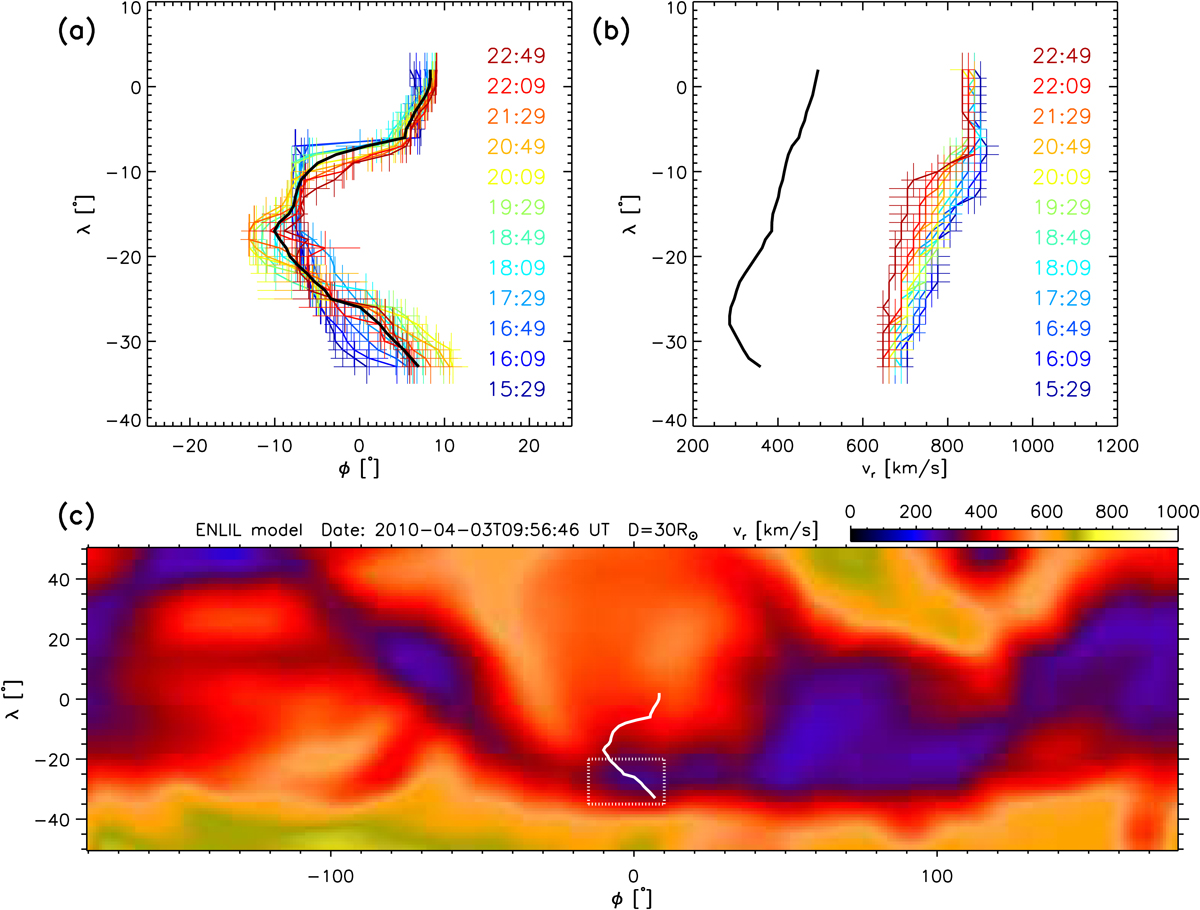
Panels a and b: angular position and radial velocity of the ejecta leading edge derived from the 3D pp map and the radial velocity map, respectively, from 15:29 UT to 22:49 UT on 3 April 2010. Different colors represent different times. The thick black curve in panel a is the temporally averaged HEE longitude (ϕ) vs. HEE latitude (λ) of the CME front at this period of time. Panel c: angular distribution of the radial velocity of the simulated background solar wind in HEE coordinates with the ENLIL code at 9:56 UT on 3 April 2010 at a heliocentric distance of 30 R⊙. The dotted white box highlights the fast-to-slow streaming interaction region. The thick white curve corresponds to the thick black curve in panel a. The radial velocity of the background solar wind along the thick white line in panel c is plotted in panel b as the thick black curve.
Current usage metrics show cumulative count of Article Views (full-text article views including HTML views, PDF and ePub downloads, according to the available data) and Abstracts Views on Vision4Press platform.
Data correspond to usage on the plateform after 2015. The current usage metrics is available 48-96 hours after online publication and is updated daily on week days.
Initial download of the metrics may take a while.