Fig. 4.
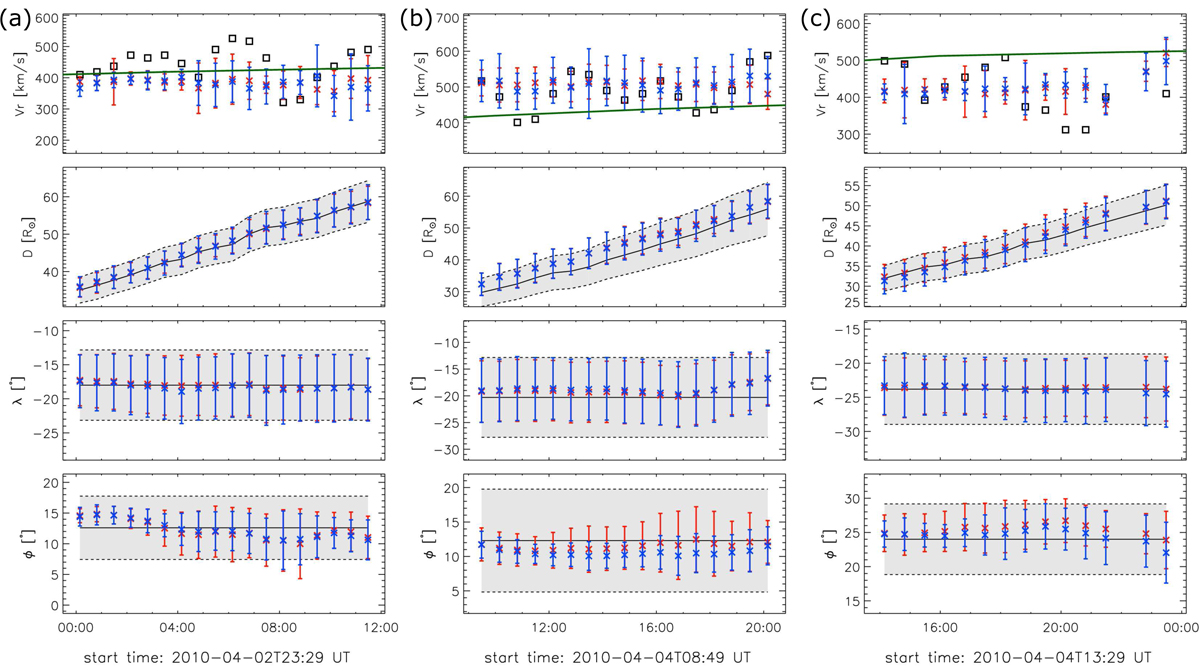
Time-dependent radial velocity and 3D position of Blobs 1-3 in Cols. a–c. Four rows from top to bottom: radial velocity (vr), distance from the solar center (D), and latitude (λ) and longitude (ϕ) of these blobs in HEE coordinates. The orange and blue crosses and error bars represent the mean value and standard deviation of the velocity or 3D pp of the blobs in the FOV of STEREO-A/B. Top row: the thick solid green lines display the simulated solar wind radial velocity with the ENLIL code, and the black squares are the results of icecream cone model. In the other rows, the black lines and the shadow regions represent the center and the range of the fitting icecream ball.
Current usage metrics show cumulative count of Article Views (full-text article views including HTML views, PDF and ePub downloads, according to the available data) and Abstracts Views on Vision4Press platform.
Data correspond to usage on the plateform after 2015. The current usage metrics is available 48-96 hours after online publication and is updated daily on week days.
Initial download of the metrics may take a while.