Fig. 2.
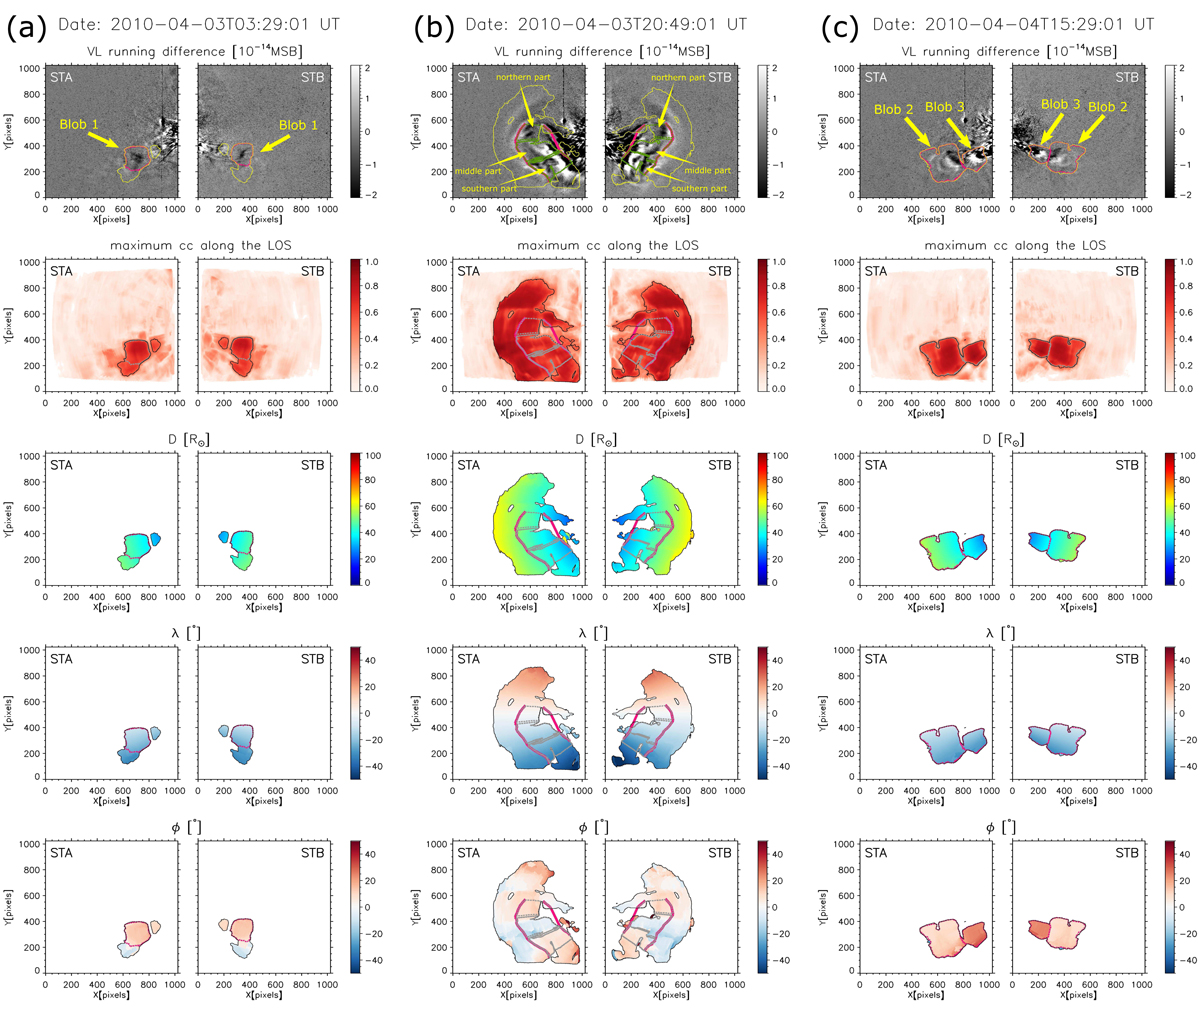
3D pp map of the transients from the perspective of STEREO-A/B. Panels a–c: Blob 1 at 03:29 UT on 3 April 2010, the CME at 20:49 UT on 3 April 2010, and Blobs 2 and 3 at 15:29 UT on 4 April 2010, respectively. Left and right columns in each panel: results from the STEREO-A and STEREO-B. Five rows from the top to the bottom: white-light (i.e., visible light (VL)) running difference images (in units of mean solar brightness (MSB)), maximum cc along the LOS, the distance from the solar center (D), the latitude (λ), and the longitude (ϕ) of the solar wind transients in HEE coordinates. The solid yellow lines in the top row and the solid black lines in the other rows denote the high-cc regions (see main text for details). Panels a and c from the top to the bottom: blob-like transients are circled with dashed purple curves in rows 1 and 3-5 and with dashed gray curves in row 2. Panel b: the leading edge and rear part of the ejecta are marked with thick solid purple curves, and the northern part (−5° < λ < 5°), middle part (−20° < λ < −5°), and southern part (−35° < λ < −20°) of the ejecta between the leading edge and the rear part are circled with dashed green curves in row 1 and dashed gray curves in rows 2-5 from the top to the bottom.
Current usage metrics show cumulative count of Article Views (full-text article views including HTML views, PDF and ePub downloads, according to the available data) and Abstracts Views on Vision4Press platform.
Data correspond to usage on the plateform after 2015. The current usage metrics is available 48-96 hours after online publication and is updated daily on week days.
Initial download of the metrics may take a while.