Free Access
Fig. A.4
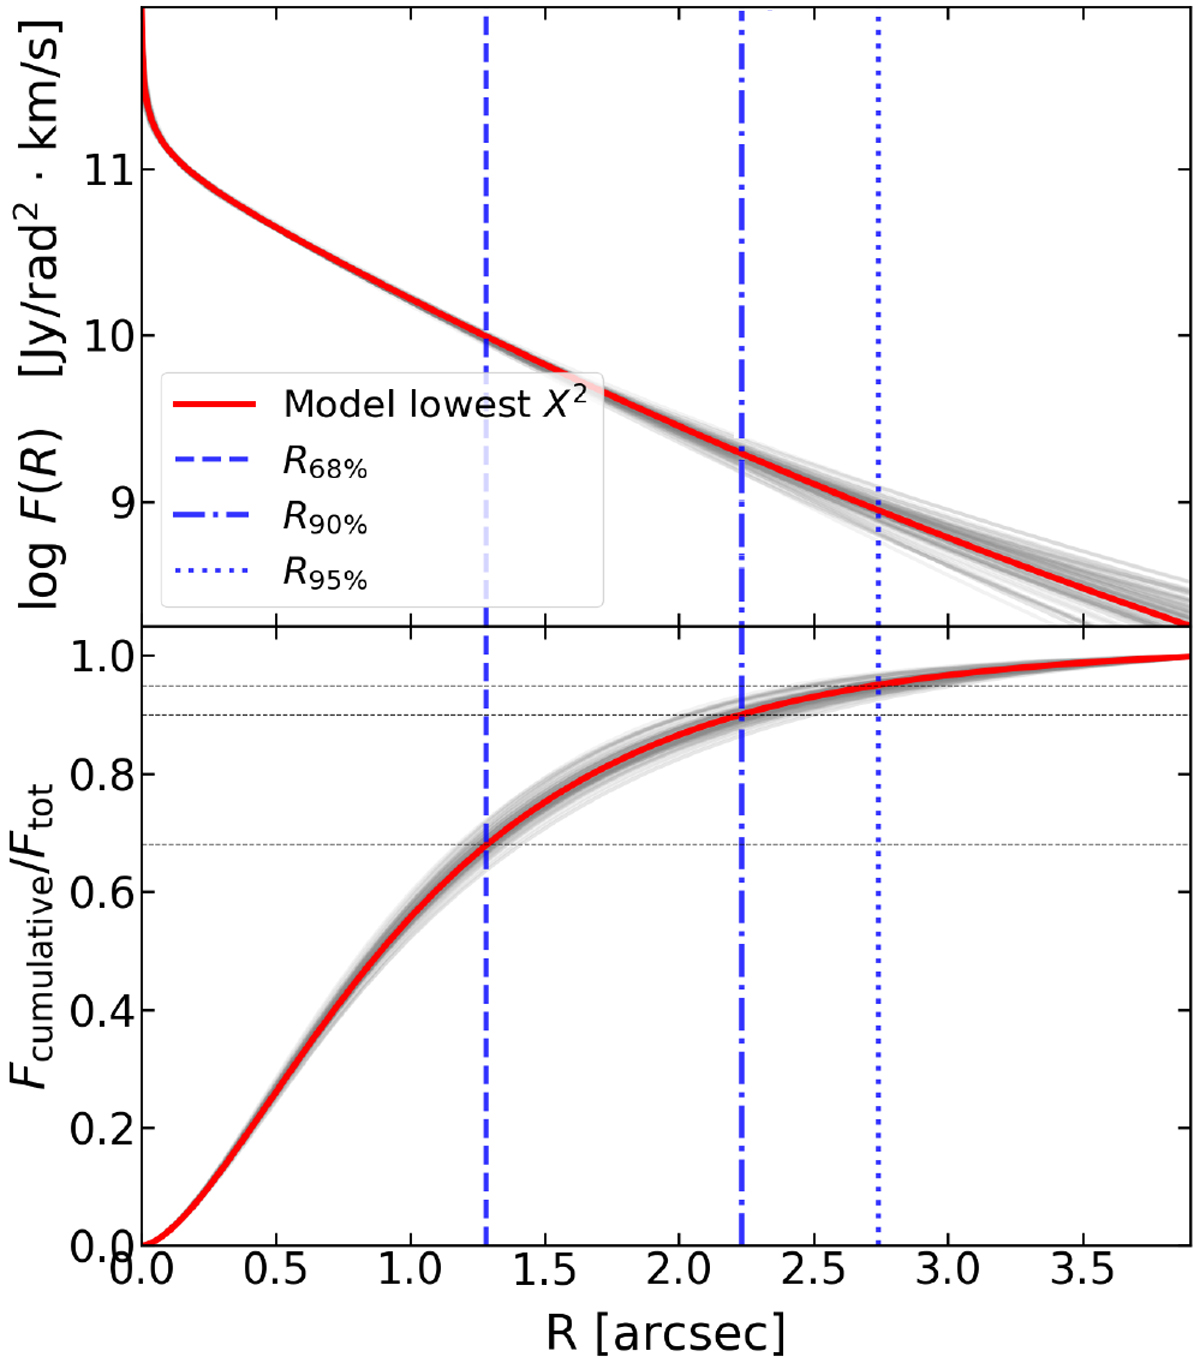
Radial brightness profile (top panel) and the associated cumulative flux (bottom panel) modeled for the CO emission of Sz 71 fit to a Nuker profile. The emission distribution of the model with lowest χ2 from the fit is drawn as red, while a subset of converged models are shown as thin gray curves.
Current usage metrics show cumulative count of Article Views (full-text article views including HTML views, PDF and ePub downloads, according to the available data) and Abstracts Views on Vision4Press platform.
Data correspond to usage on the plateform after 2015. The current usage metrics is available 48-96 hours after online publication and is updated daily on week days.
Initial download of the metrics may take a while.