Fig. A.1
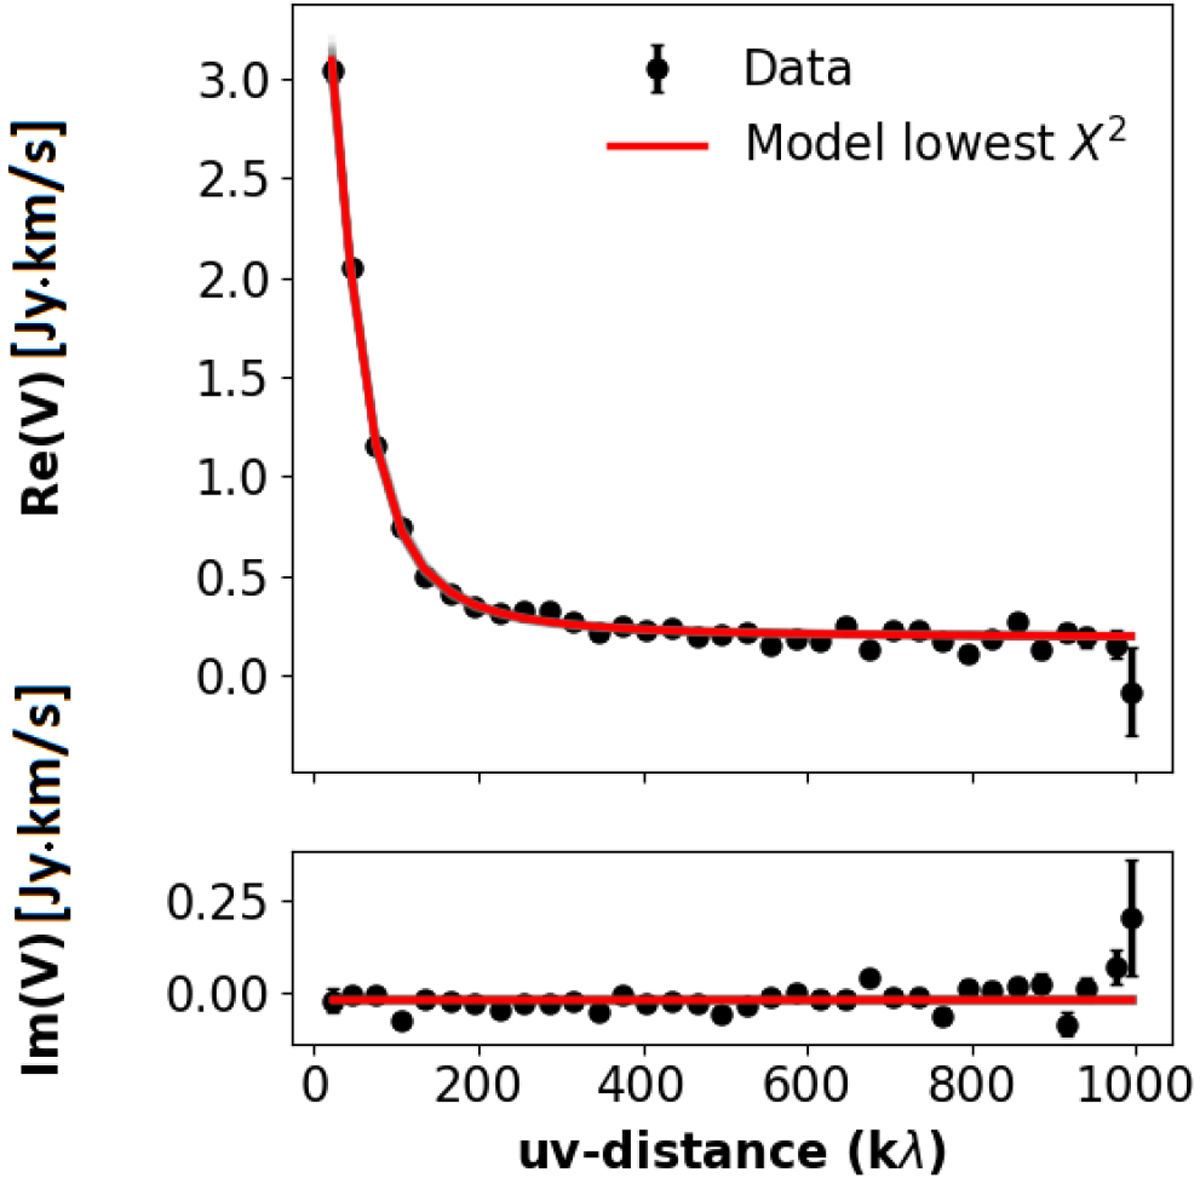
Observed and model visibilities of Sz 71 CO emission, plotted as real and imaginary parts as a function of the baseline (in kλ). The data from the observations are plotted as black data points with error bars, the model with the lowest χ2 is shown as solid red curve, and a random set of converged models from the parameter space investigation are drawn as gray curves (mostly covered by the lowest χ2 model). This figure was made with the uvplot Python package (Tazzari 2017).
Current usage metrics show cumulative count of Article Views (full-text article views including HTML views, PDF and ePub downloads, according to the available data) and Abstracts Views on Vision4Press platform.
Data correspond to usage on the plateform after 2015. The current usage metrics is available 48-96 hours after online publication and is updated daily on week days.
Initial download of the metrics may take a while.