Fig. 5
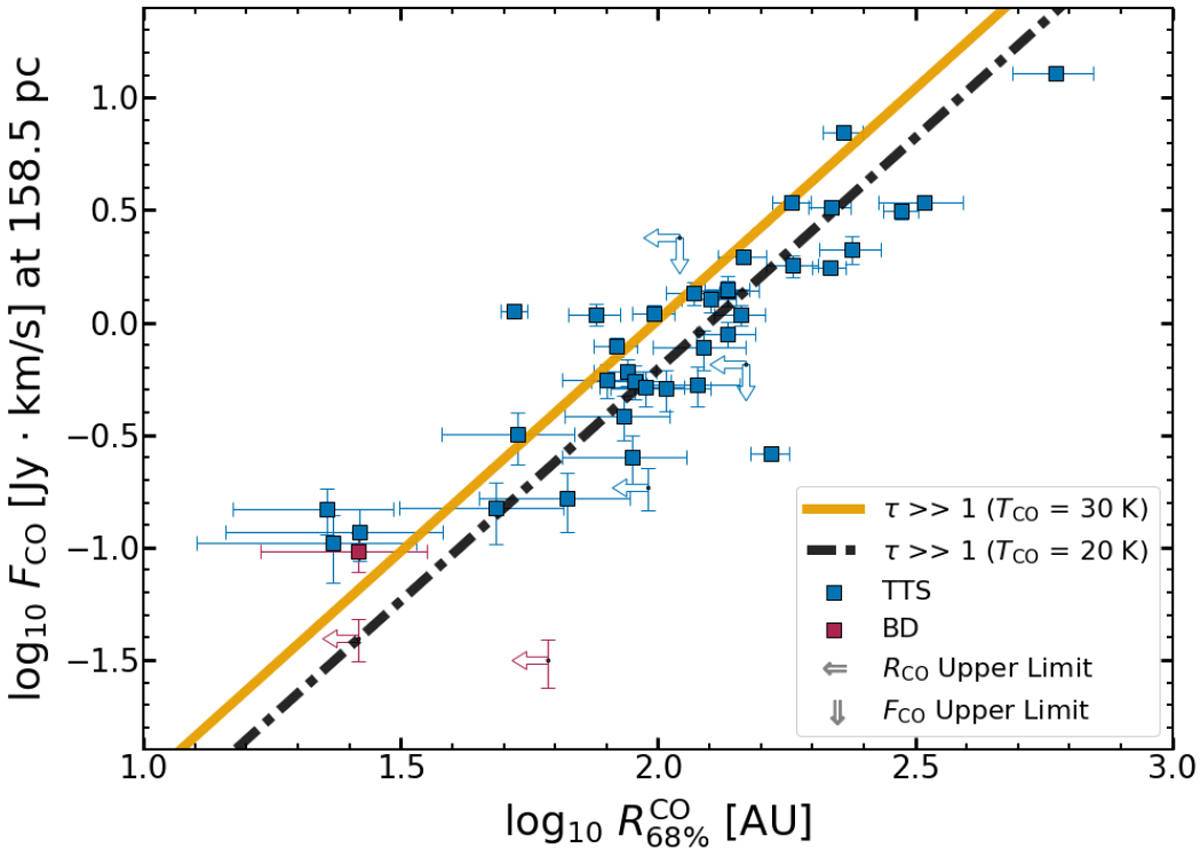
Relation between the radius enclosing 68% of the total CO flux (scaled at the median distance of the region, and deprojected with inclination) and the flux enclosed by that radius for the entire Lupus CO disk population. Lines represent optically thick emission of CO with an average temperature of 30 (orange) and 20 K (black dash-dotted). Objects with outflows within the measured radius are considered to be upper limits in FCO .
Current usage metrics show cumulative count of Article Views (full-text article views including HTML views, PDF and ePub downloads, according to the available data) and Abstracts Views on Vision4Press platform.
Data correspond to usage on the plateform after 2015. The current usage metrics is available 48-96 hours after online publication and is updated daily on week days.
Initial download of the metrics may take a while.