Fig. E.1
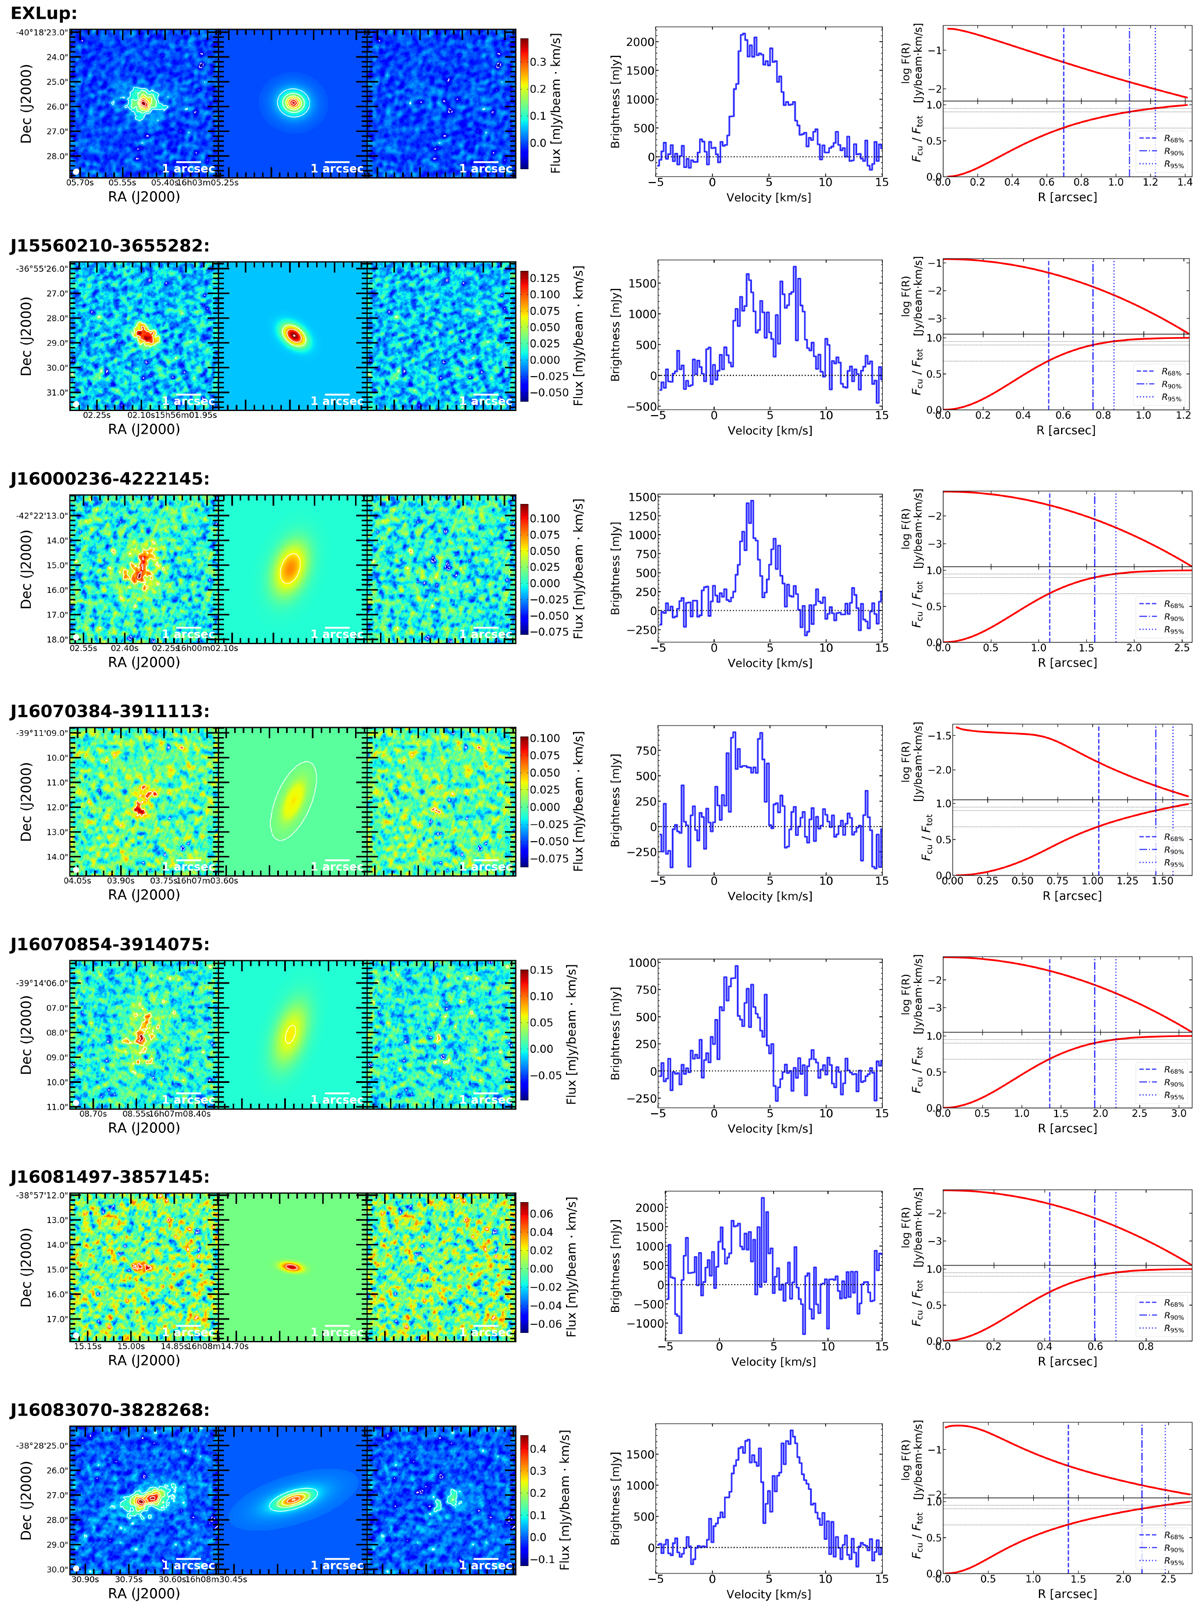
Results of the CO modeling for every disk with a measured CO size, following the methodology described in Sect. 3.1. For each disk, the first three subpanels show the observed, model, and residual CO moment zero maps; solid (dashed) line contours are drawn at increasing (decreasing) 3σ intervals. Forth subpanel: integrated spectrum enclosed by the ![]() .
Last subpanel: radial brightness profile and the respective cumulative distribution of the CO model.
.
Last subpanel: radial brightness profile and the respective cumulative distribution of the CO model.
Current usage metrics show cumulative count of Article Views (full-text article views including HTML views, PDF and ePub downloads, according to the available data) and Abstracts Views on Vision4Press platform.
Data correspond to usage on the plateform after 2015. The current usage metrics is available 48-96 hours after online publication and is updated daily on week days.
Initial download of the metrics may take a while.