Fig. 1
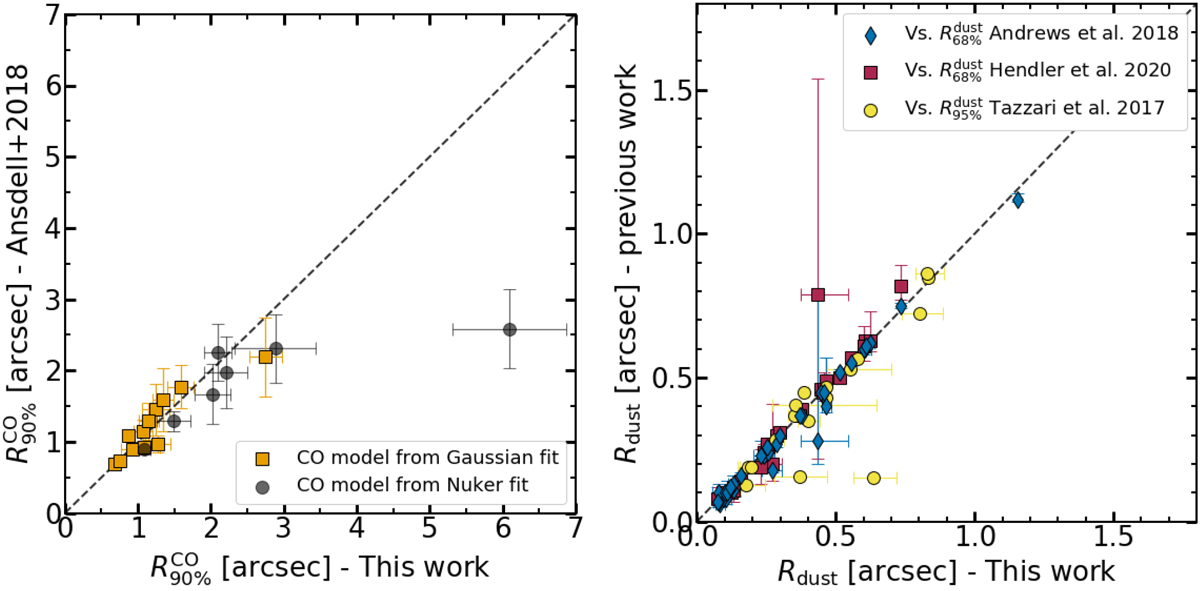
Left panel: comparison between ![]() sizes from Ansdell et al. (2018) and the sizes inferred in this work by fitting an elliptical Gaussian model (orange) or a Nuker function in the azimuthally averaged integrated emission (black). Right panel: comparison between
Rdust sizes from this work and the literature (i.e., Andrews et al. 2018b; Hendler et al. 2020; Tazzari et al. 2017).
sizes from Ansdell et al. (2018) and the sizes inferred in this work by fitting an elliptical Gaussian model (orange) or a Nuker function in the azimuthally averaged integrated emission (black). Right panel: comparison between
Rdust sizes from this work and the literature (i.e., Andrews et al. 2018b; Hendler et al. 2020; Tazzari et al. 2017).
Current usage metrics show cumulative count of Article Views (full-text article views including HTML views, PDF and ePub downloads, according to the available data) and Abstracts Views on Vision4Press platform.
Data correspond to usage on the plateform after 2015. The current usage metrics is available 48-96 hours after online publication and is updated daily on week days.
Initial download of the metrics may take a while.