Fig. A.1.
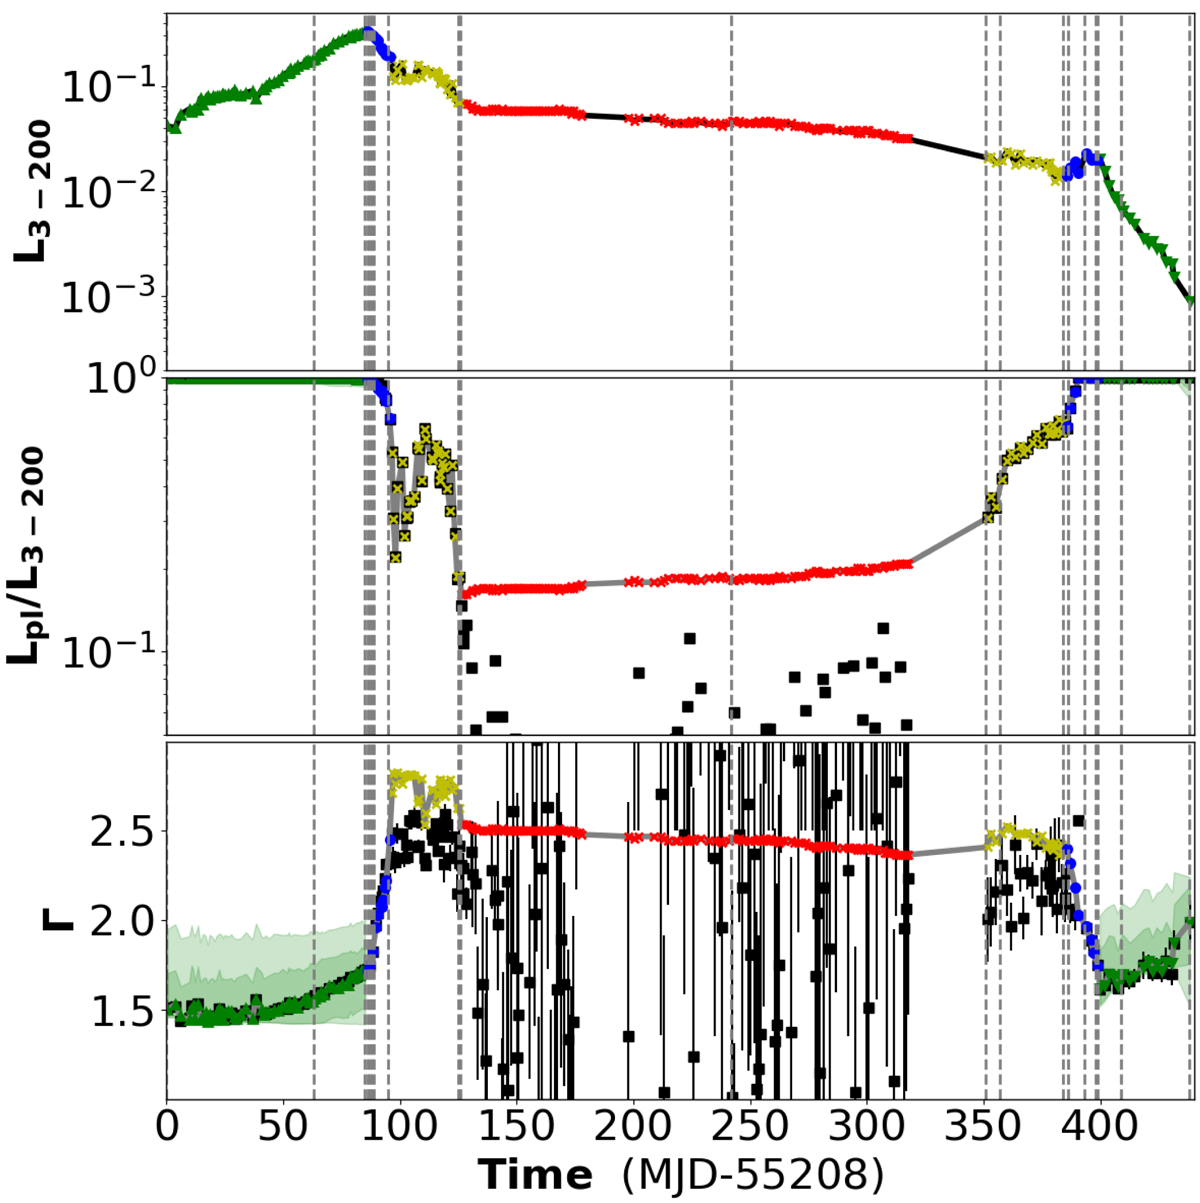
Results of the fitting procedure of Marcel et al. (2019) applied to the 2010–2011 outburst of GX 339-4. The black markers are fits taken from Clavel et al. (2016) reported with their error bars when reliable, while color lines display the best fit values obtained with the JED-SAD SED: Green, blue, yellow, and red correspond to hard, hard-intermediate, soft-intermediate, and soft states, respectively. From top to bottom: 3–200 keV total luminosity, L3−200 (in Eddington units), the power-law luminosity fraction Lpl/L3−200, defined as the ratio of the power-law flux to the total flux in the 3–200 keV range, and the power-law index Γ. The transparent colored areas correspond to the confidence intervals of a 5% and 10% error margin (see Marcel et al. 2019). The vertical dashed line corresponds to the MJD reported in Table 1.
Current usage metrics show cumulative count of Article Views (full-text article views including HTML views, PDF and ePub downloads, according to the available data) and Abstracts Views on Vision4Press platform.
Data correspond to usage on the plateform after 2015. The current usage metrics is available 48-96 hours after online publication and is updated daily on week days.
Initial download of the metrics may take a while.