Fig. 4.
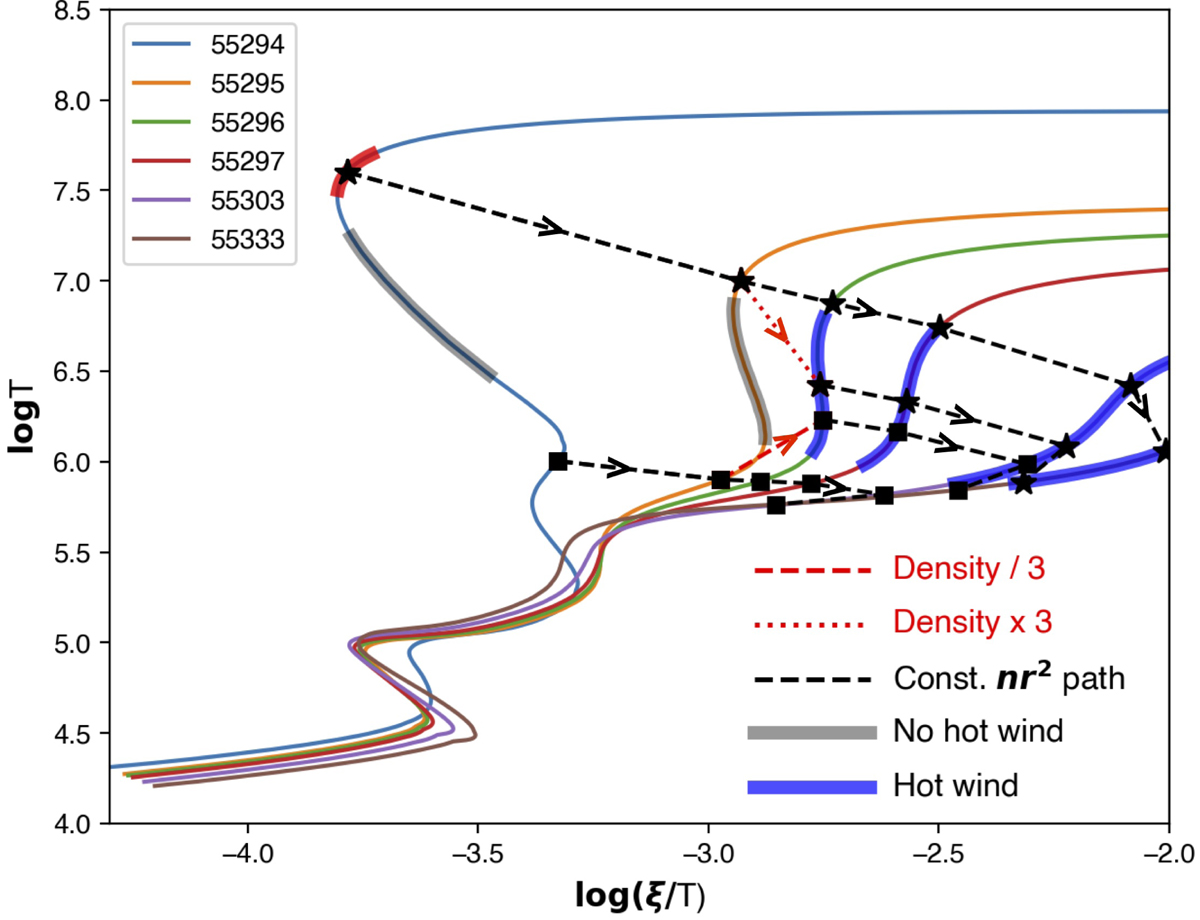
Colored lines are the photoionization stability curves during the hard-to-soft transition (see Fig. 2 for the meaning of the blue and gray segments). The black dashed lines (squares and dashed line; star and dashed line) correspond to different paths with constant nr2. The red lines are the paths followed by the wind assuming an increase (red dotted path) or decrease (red dashed path) in the wind density by a factor of 3 between MJD 55295 and MJD 55296. See Sect. 4.1.1 for the small temperature domain underlined in red on the stability curve of MJD 55294. The arrows indicate the time evolution.
Current usage metrics show cumulative count of Article Views (full-text article views including HTML views, PDF and ePub downloads, according to the available data) and Abstracts Views on Vision4Press platform.
Data correspond to usage on the plateform after 2015. The current usage metrics is available 48-96 hours after online publication and is updated daily on week days.
Initial download of the metrics may take a while.