Fig. 2.
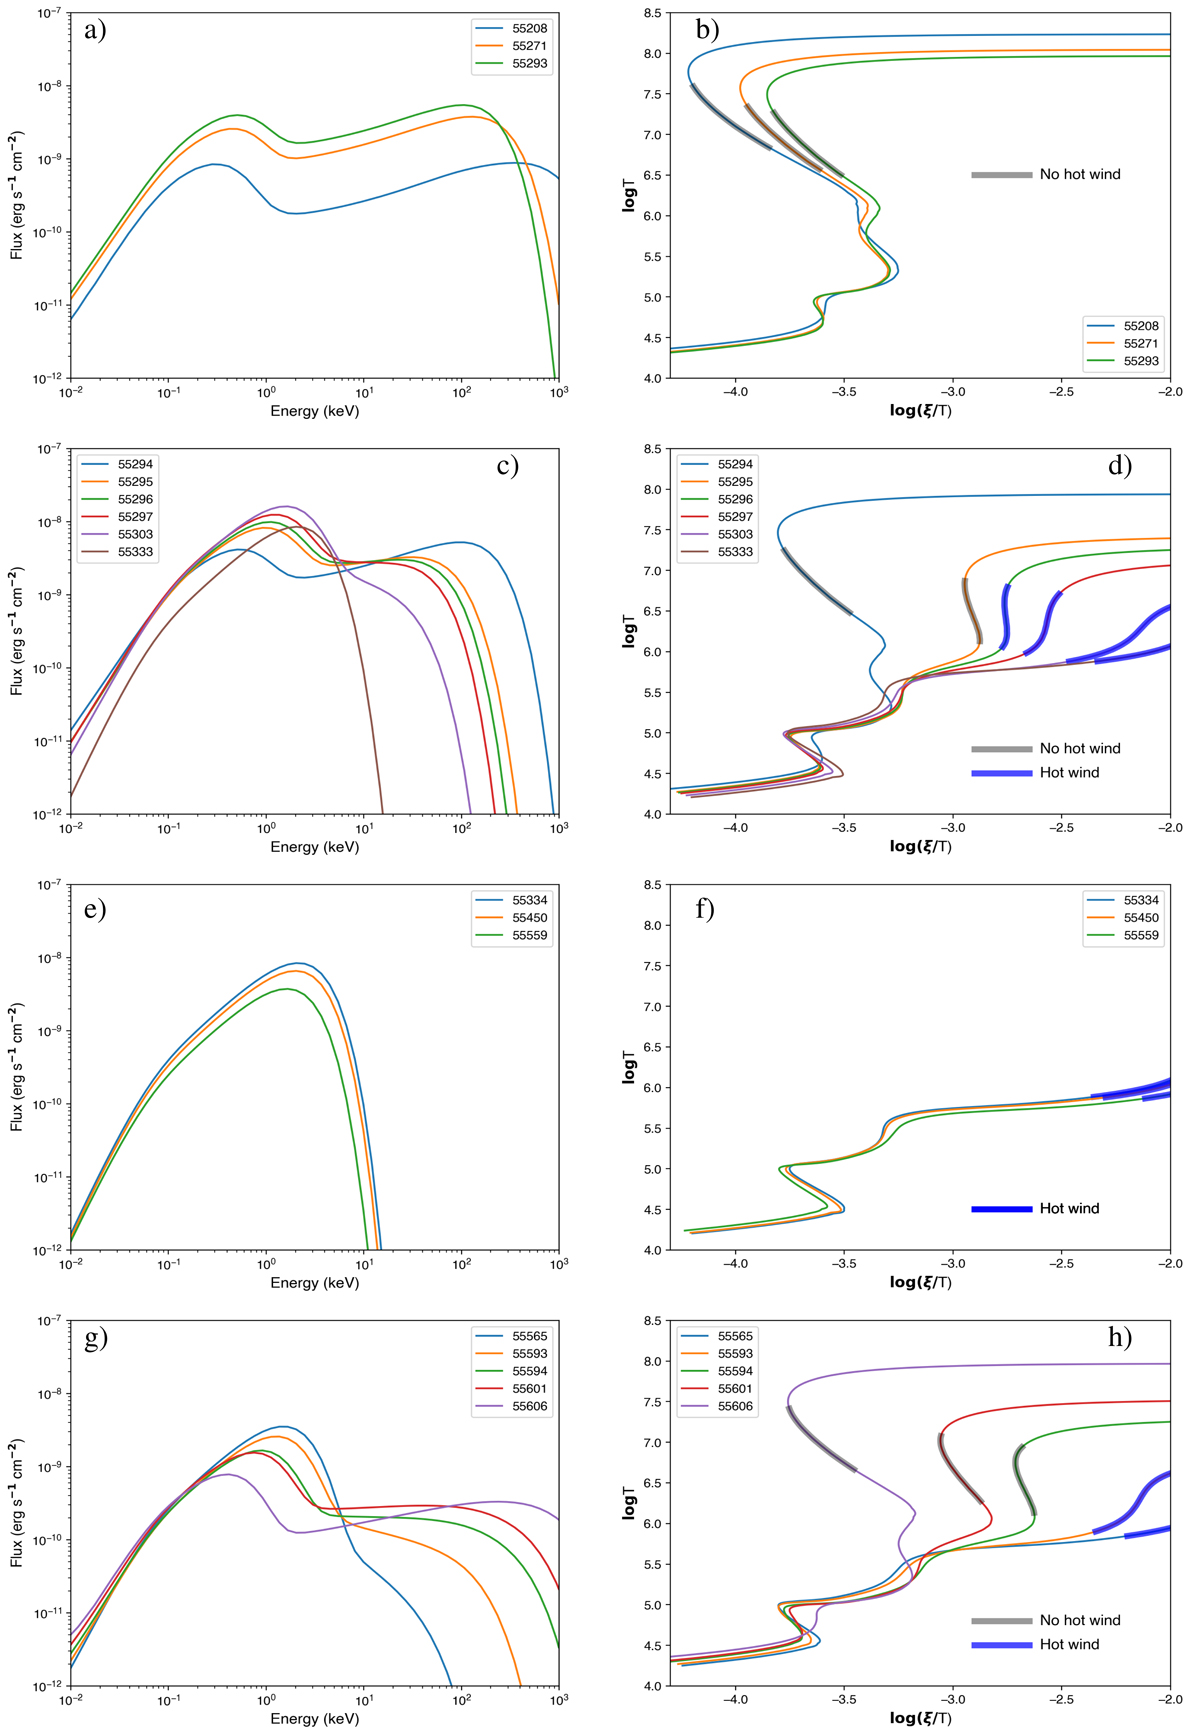
SED (left) and corresponding photoionization stability curves (right) between MJD 55208 and 55293 (hard state, a and b), MJD 55294 and 55303 (hard-to-soft transition, c and d), MJD 55304 and 55592 (soft state, e and f) and MJD 55593 and 55606 (soft-to-hard transition, g and h). The stability curves are labeled with their corresponding MJD. The highlighted (blue and gray) areas on each curve correspond to the range of the ionization parameter consistent with Fe XXV and Fe XXVI. They are colored in blue (resp. gray) if they are located on a stable (resp. unstable) part of the stability curve.
Current usage metrics show cumulative count of Article Views (full-text article views including HTML views, PDF and ePub downloads, according to the available data) and Abstracts Views on Vision4Press platform.
Data correspond to usage on the plateform after 2015. The current usage metrics is available 48-96 hours after online publication and is updated daily on week days.
Initial download of the metrics may take a while.