Fig. C.1.
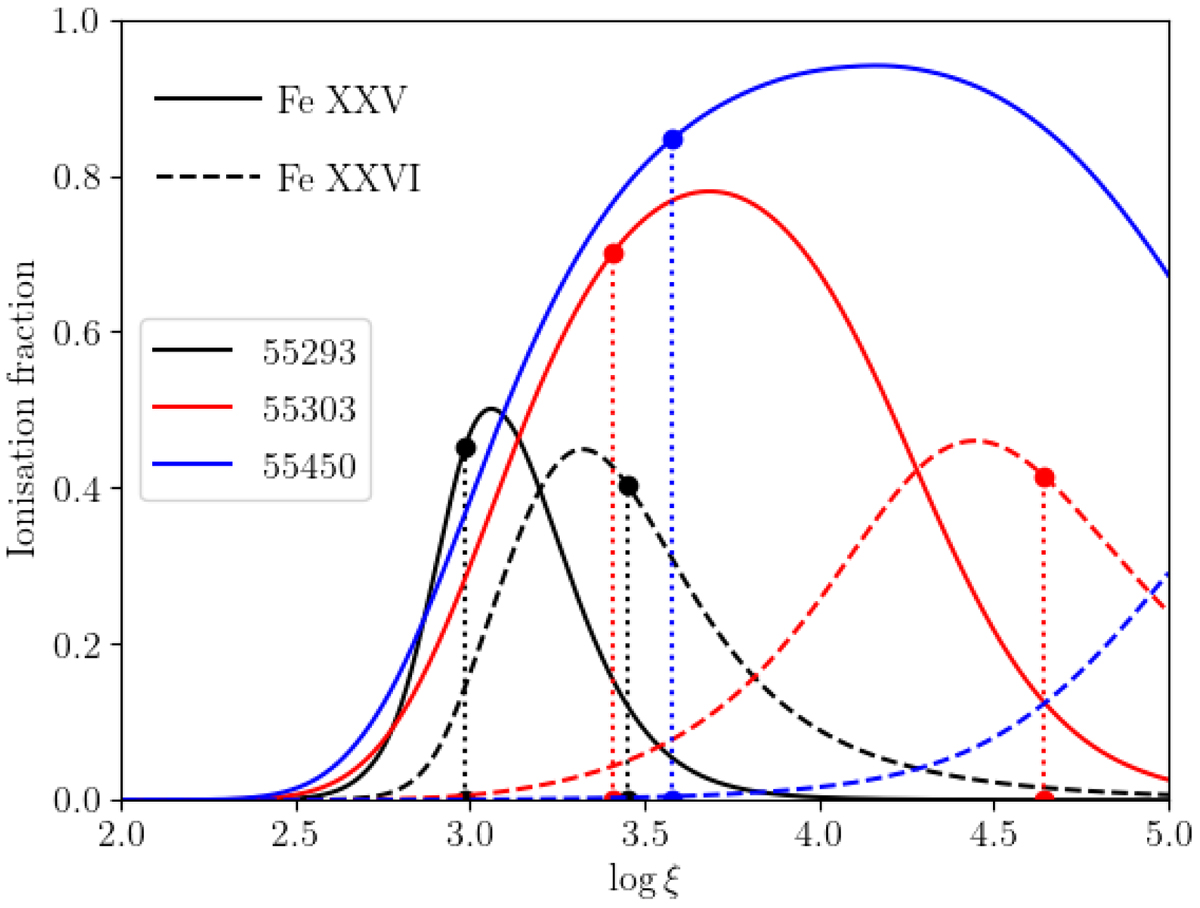
Fe XXV (solid lines) and Fe XXVI (dashed lines) ion fractions for three MJD of the 2010–2011 outburst of GX 339-4. They were computed by using the SED of Marcel et al. (2019). The vertical dotted lines define, for each curve, the range in log ξ used to create the highlighted (blue or gray) areas on the stability curves presented in this paper. The lower limit in log ξ for each range corresponds to an ionic fraction equal to 90 percent of the ionic fraction peak of Fe XXV, while the upper limit corresponds to an ionic fraction equal to 90 percent of the ionic fraction peak of Fe XXVI. If this upper limit is larger than five (like for MJD 55450), it is put equal to five.
Current usage metrics show cumulative count of Article Views (full-text article views including HTML views, PDF and ePub downloads, according to the available data) and Abstracts Views on Vision4Press platform.
Data correspond to usage on the plateform after 2015. The current usage metrics is available 48-96 hours after online publication and is updated daily on week days.
Initial download of the metrics may take a while.