Fig. 1.
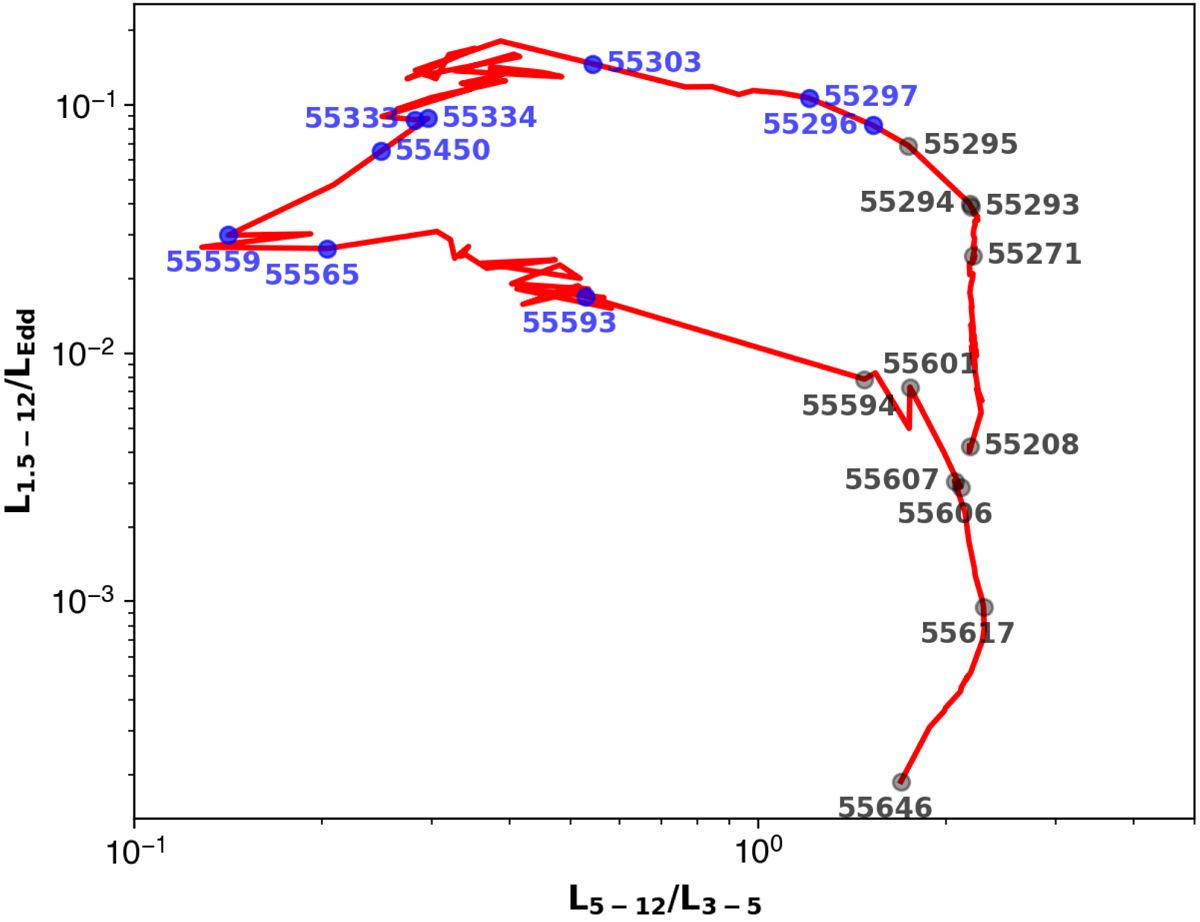
HID of the 2010–2011 outburst of GX 339-4. The position of the observations reported in Table 1 are indicated with blue and black colors and are labeled on the HID with their MJD. The black (resp. blue) MJD correspond to observations whose range of the ionization parameter consistent with Fe XXV and Fe XXVI ions is in an unstable (resp. stable) part of the photoionization stability curves. We have distributed the MJD observations in terms of modeled SED and associated stability curves in Fig. 2.
Current usage metrics show cumulative count of Article Views (full-text article views including HTML views, PDF and ePub downloads, according to the available data) and Abstracts Views on Vision4Press platform.
Data correspond to usage on the plateform after 2015. The current usage metrics is available 48-96 hours after online publication and is updated daily on week days.
Initial download of the metrics may take a while.