Fig. 3.
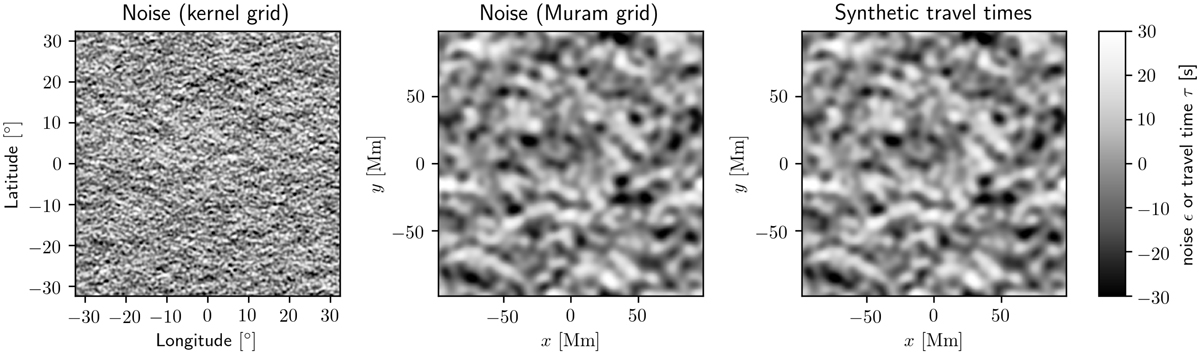
Example realizations of the noise ϵ(x) from our noise model on the kernel (left) and MURaM grids (middle), and synthetic noisy travel times τ(x) (right). The noise has a standard deviation of 10.3 s and the travel-time signal in the right panel of 1.9 s, which compares well with the data (Hanasoge et al. 2012). Left panel: can be compared to Fig. 5 in the supplementary material of Hanasoge et al. (2012). Figure 2 shows the contribution of the travel-time signal to the right panel in more detail.
Current usage metrics show cumulative count of Article Views (full-text article views including HTML views, PDF and ePub downloads, according to the available data) and Abstracts Views on Vision4Press platform.
Data correspond to usage on the plateform after 2015. The current usage metrics is available 48-96 hours after online publication and is updated daily on week days.
Initial download of the metrics may take a while.