Open Access
Fig. C.3.
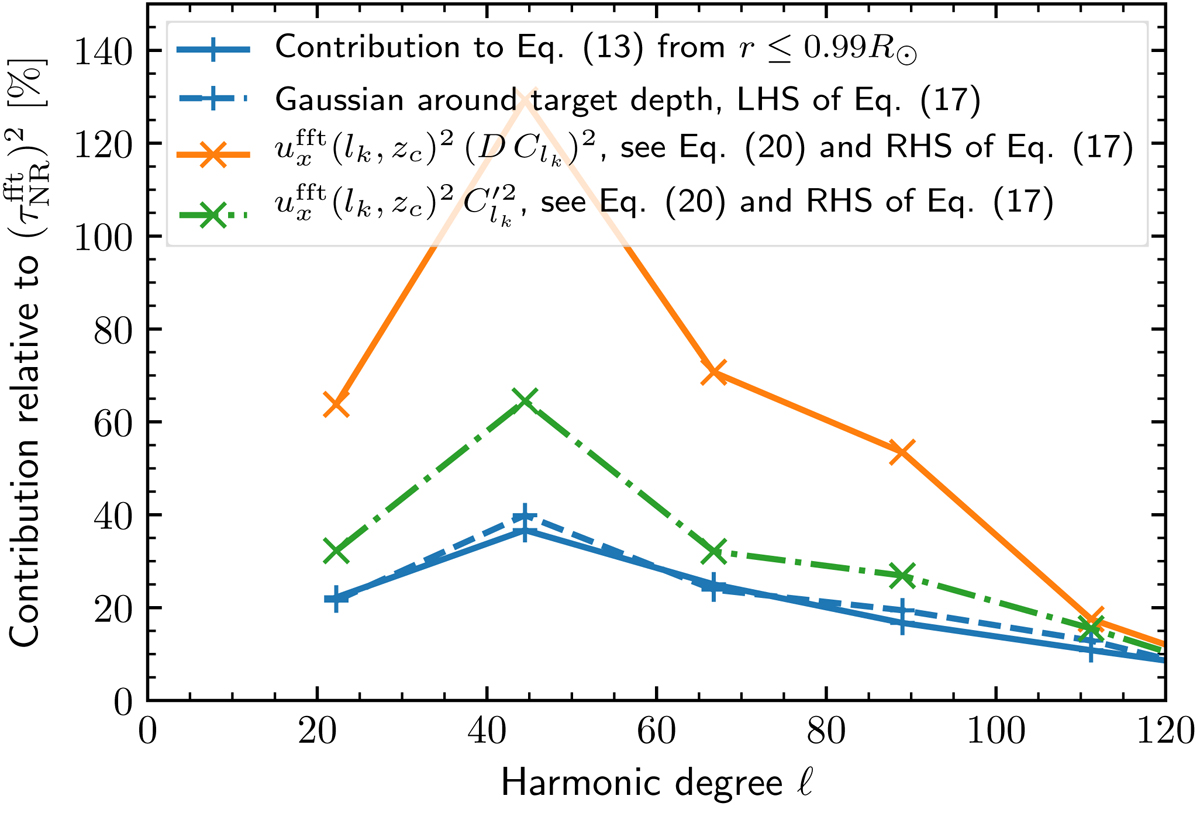
Contribution to the noiseless travel-time spectrum ![]() from below 0.99R⊙ (solid blue line) and from a Gaussian-weighted region around the target depth 0.96R⊙ (dashed blue) and their forward models based on the actual flow and two versions of the calibration curve (solid orange and dash-dotted green).
from below 0.99R⊙ (solid blue line) and from a Gaussian-weighted region around the target depth 0.96R⊙ (dashed blue) and their forward models based on the actual flow and two versions of the calibration curve (solid orange and dash-dotted green).
Current usage metrics show cumulative count of Article Views (full-text article views including HTML views, PDF and ePub downloads, according to the available data) and Abstracts Views on Vision4Press platform.
Data correspond to usage on the plateform after 2015. The current usage metrics is available 48-96 hours after online publication and is updated daily on week days.
Initial download of the metrics may take a while.