Fig. 4.
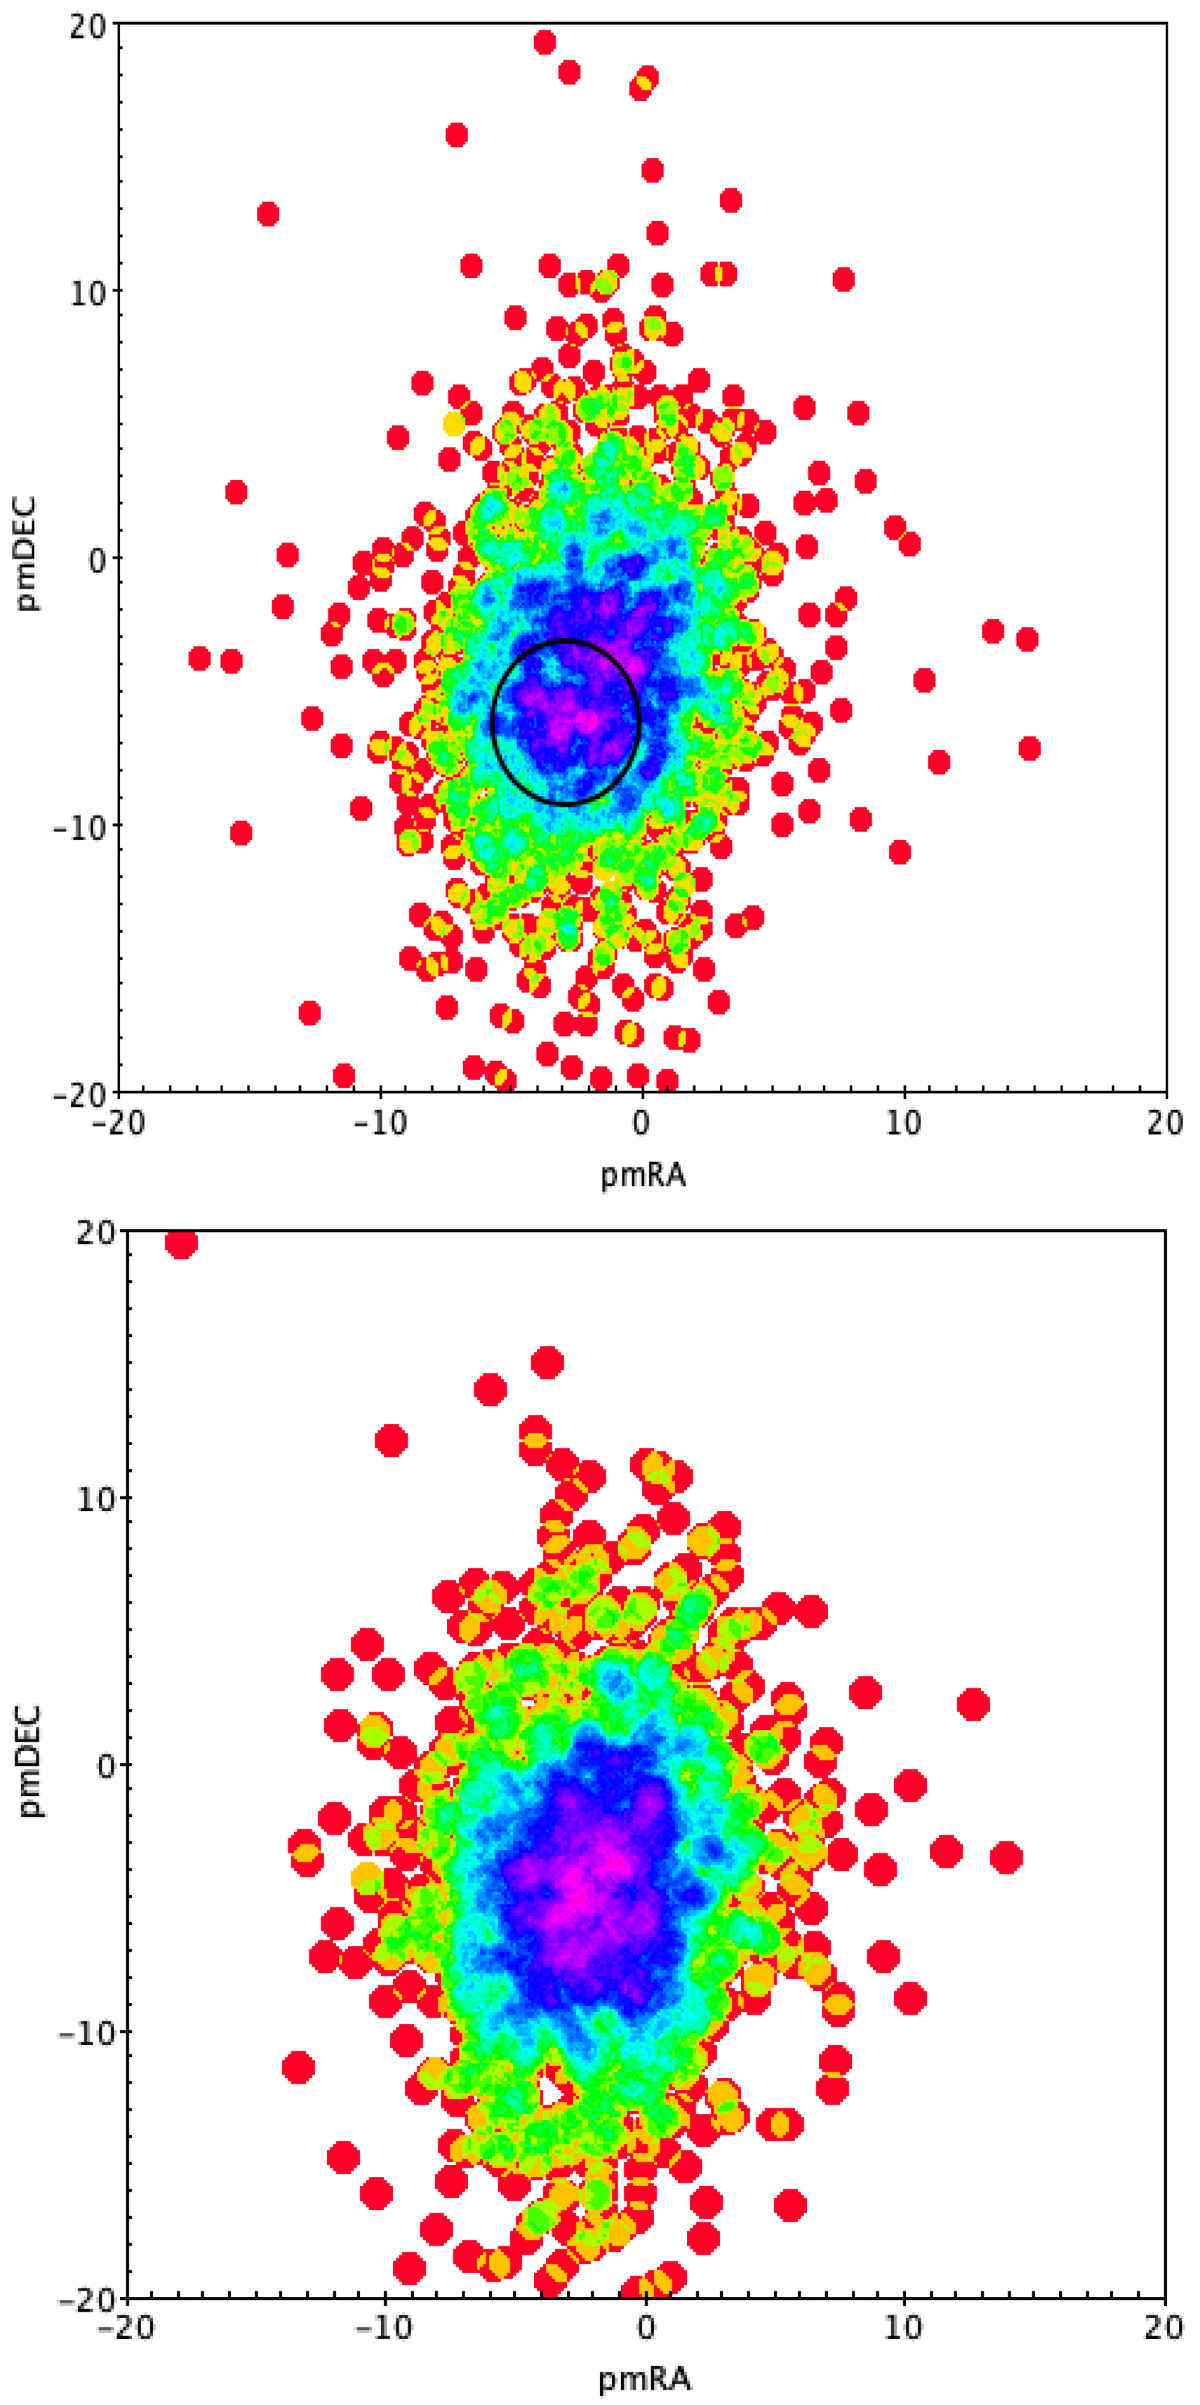
Top panel: VPM diagram from Gaia DR 2 dataset for star members located within 3′ from the Patchick 99 centre. The black circle indicates the position of the cluster selection within 3 mas yr−1. Bottom panel: VPM diagram for field stars located at 4.8′ from the Patchick 99 centre. In each panel, colour represents density, with magenta being the highest, followed by blue, green, and red.
Current usage metrics show cumulative count of Article Views (full-text article views including HTML views, PDF and ePub downloads, according to the available data) and Abstracts Views on Vision4Press platform.
Data correspond to usage on the plateform after 2015. The current usage metrics is available 48-96 hours after online publication and is updated daily on week days.
Initial download of the metrics may take a while.