Free Access
Fig. 13.
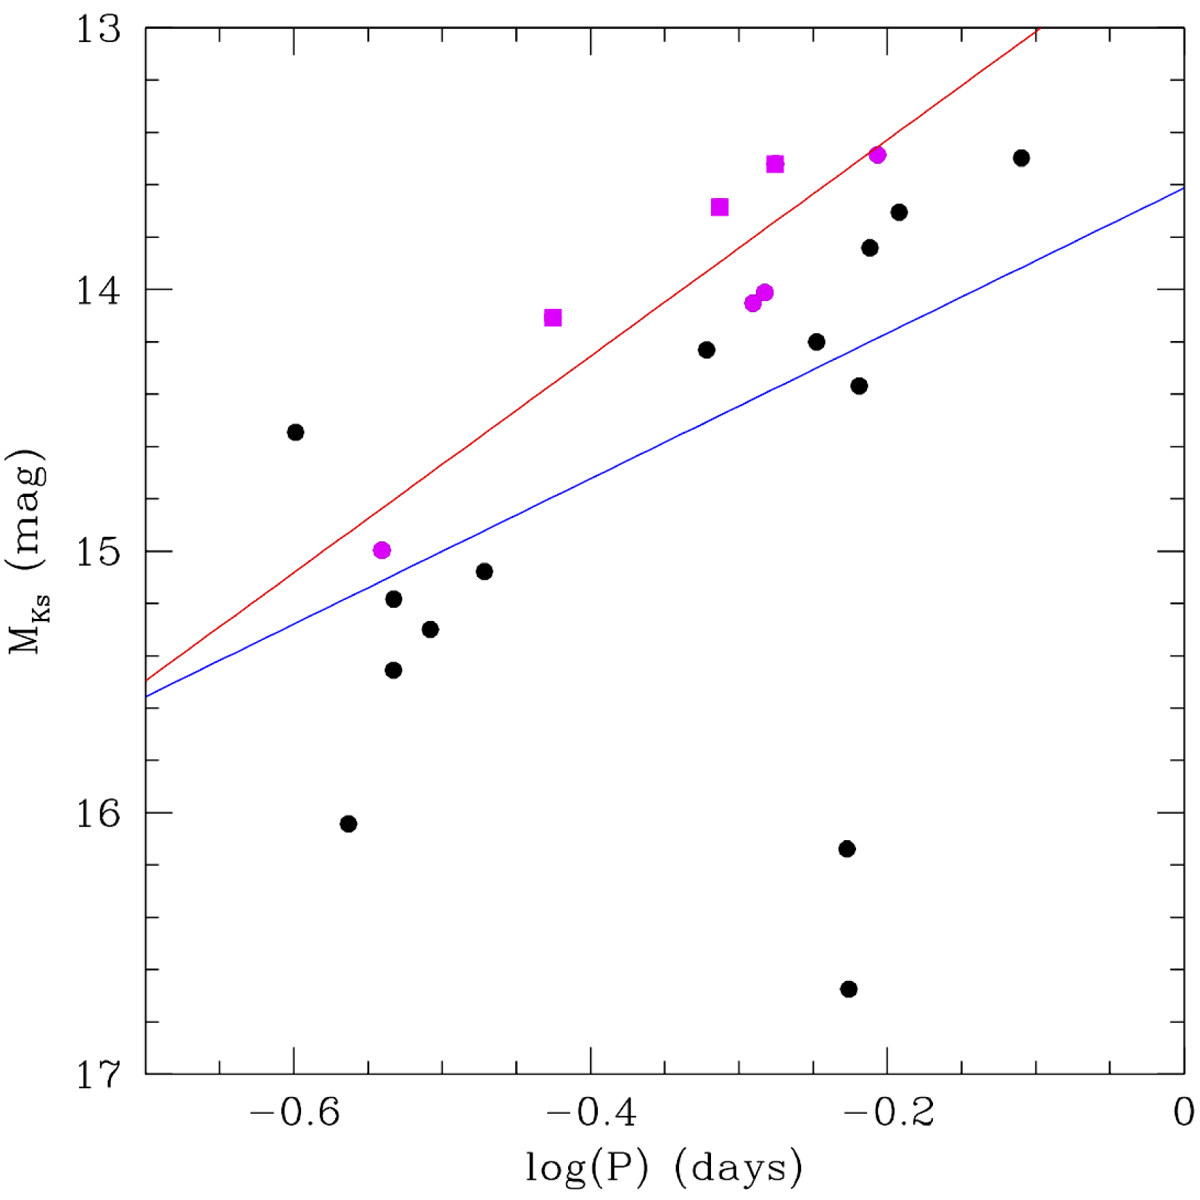
MKs − log(P) diagram for the whole RR Lyrae sample (black points) and all RR Lyrae star members (magenta points, while the squares represent the PM variable members). Blue and red lines represent the least-squares fit for the whole RR Lyrae sample and all cluster members, respectively.
Current usage metrics show cumulative count of Article Views (full-text article views including HTML views, PDF and ePub downloads, according to the available data) and Abstracts Views on Vision4Press platform.
Data correspond to usage on the plateform after 2015. The current usage metrics is available 48-96 hours after online publication and is updated daily on week days.
Initial download of the metrics may take a while.