| Issue |
A&A
Volume 649, May 2021
|
|
|---|---|---|
| Article Number | C2 | |
| Number of page(s) | 2 | |
| Section | Stellar structure and evolution | |
| DOI | https://doi.org/10.1051/0004-6361/202039044e | |
| Published online | 04 May 2021 | |
Small glitches and other rotational irregularities of the Vela pulsar (Corrigendum)
1
Departamento de Física, Universidad de Santiago de Chile (USACH), Estación Central, Santiago 9170124, Chile
e-mail: This email address is being protected from spambots. You need JavaScript enabled to view it.
2
Nicolaus Copernicus Astronomical Center, Polish Academy of Sciences, ul. Bartycka 18, 00-716 Warsaw, Poland
3
Jodrell Bank Centre for Astrophysics, School of Physics and Astronomy, The University of Manchester, Manchester M13 9PL, UK
4
International Centre for Radio Astronomy Research, University of Western Australia, Crawley, WA 6009, Australia
5
Instituto de Astrofísica, Pontificia Universidad Católica de Chile, 782-0436 Macul, Santiago, Chile
Key words: stars: neutron / pulsars: general / pulsars: individual: PSR B0833–45 / stars: rotation / errata, addenda
There was an error with the plotted lines that indicate detection capabilities in quadrants I and III of Fig. 9 (for events with Δν and  of equal signs). The correct figure and updated caption is below.
Section 6: To accommodate the correction to Fig. 9, the last sentence of the second paragraph must read “For the other events (quadrants I and III) we used the condition  as an indication for event sizes that would be under typical noise levels”.
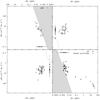 |
Fig. 1. Sizes of all the irregularities selected for all possible combinations of signs for Δν and |


© ESO 2021
All Figures
|
Fig. 1. Sizes of all the irregularities selected for all possible combinations of signs for Δν and |
| In the text | |
Current usage metrics show cumulative count of Article Views (full-text article views including HTML views, PDF and ePub downloads, according to the available data) and Abstracts Views on Vision4Press platform.
Data correspond to usage on the plateform after 2015. The current usage metrics is available 48-96 hours after online publication and is updated daily on week days.
Initial download of the metrics may take a while.