Fig. 2
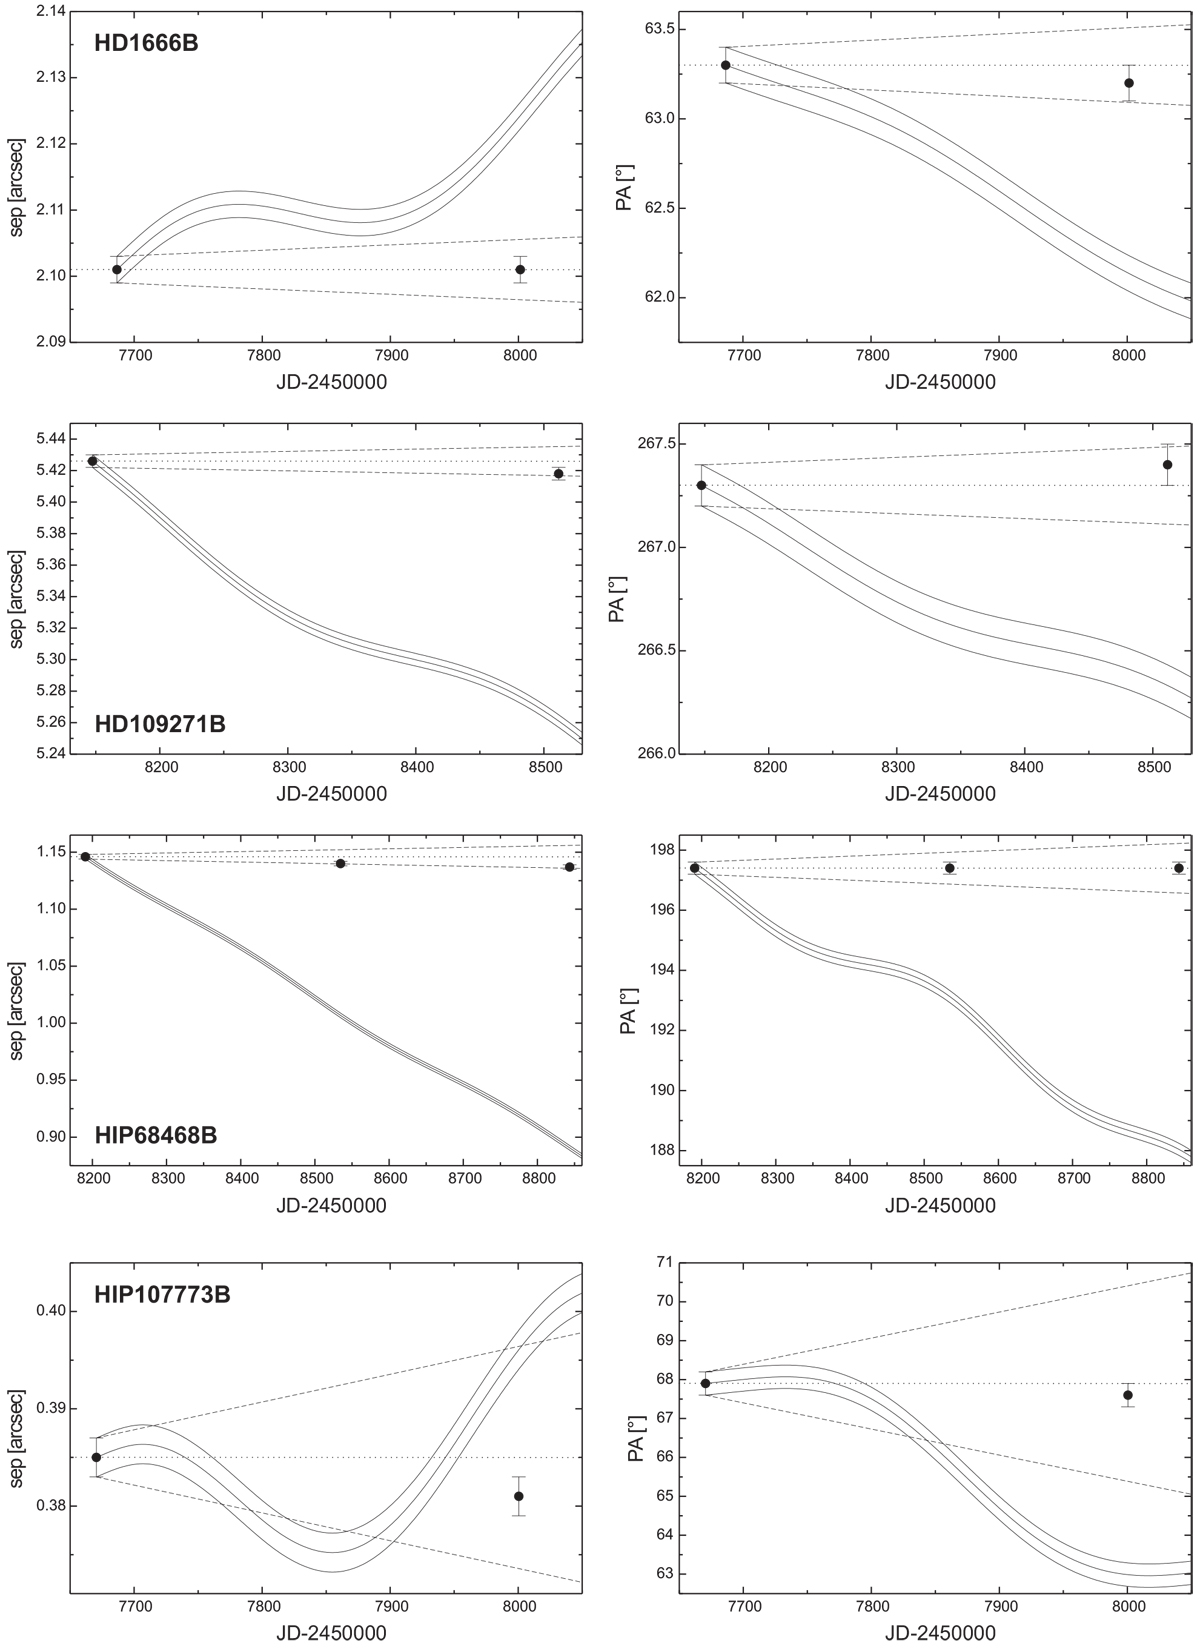
Proper motion diagrams of all detected stellar companions. The separations and position angles of the companion relative to the primary stars are plotted versus time. The “oscillating,” solid lines show the area in which a nonmoving background object would be expected. The dashed lines show the area where a co-moving, bound object would be expected; this also takes possible orbital motion into account.
Current usage metrics show cumulative count of Article Views (full-text article views including HTML views, PDF and ePub downloads, according to the available data) and Abstracts Views on Vision4Press platform.
Data correspond to usage on the plateform after 2015. The current usage metrics is available 48-96 hours after online publication and is updated daily on week days.
Initial download of the metrics may take a while.