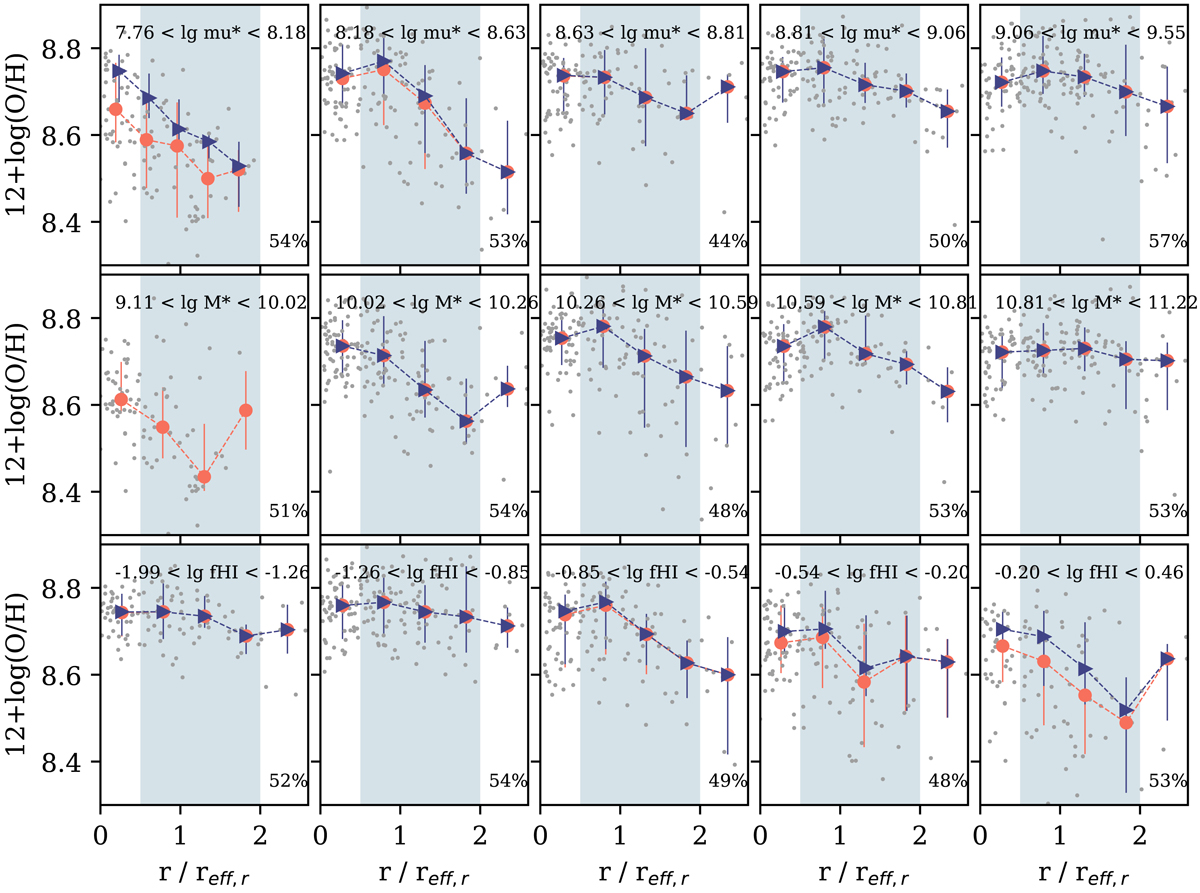
Fig. 9.

Median metallicity profiles in bins of different global galaxy properties. Each row of plots corresponds to one global galaxy property, from top to bottom: μ⋆, M⋆, and fHI. Each panel in a row shows average radial metallicity profiles of all galaxies within the bin of the global galaxy property, with the range given at the top of the panel. The dark shaded region corresponds to 0.5 ≤ reff, r ≤ 2.0, which is the radial region within which MaNGA computes metallicity gradients. Circles show the median metallicity profiles of all galaxies and triangles the median metallicity profile of massive galaxies only (M⋆ > 1010 M⊙). These profiles have been computed in radial bins, all of which have the same radial width. The small grey dots show the individual radial metallicity data points. The number in the bottom right corner of each panel indicates the percentage of radial data points located within the range 0.5 ≤ reff, r ≤ 2.0.
Current usage metrics show cumulative count of Article Views (full-text article views including HTML views, PDF and ePub downloads, according to the available data) and Abstracts Views on Vision4Press platform.
Data correspond to usage on the plateform after 2015. The current usage metrics is available 48-96 hours after online publication and is updated daily on week days.
Initial download of the metrics may take a while.


