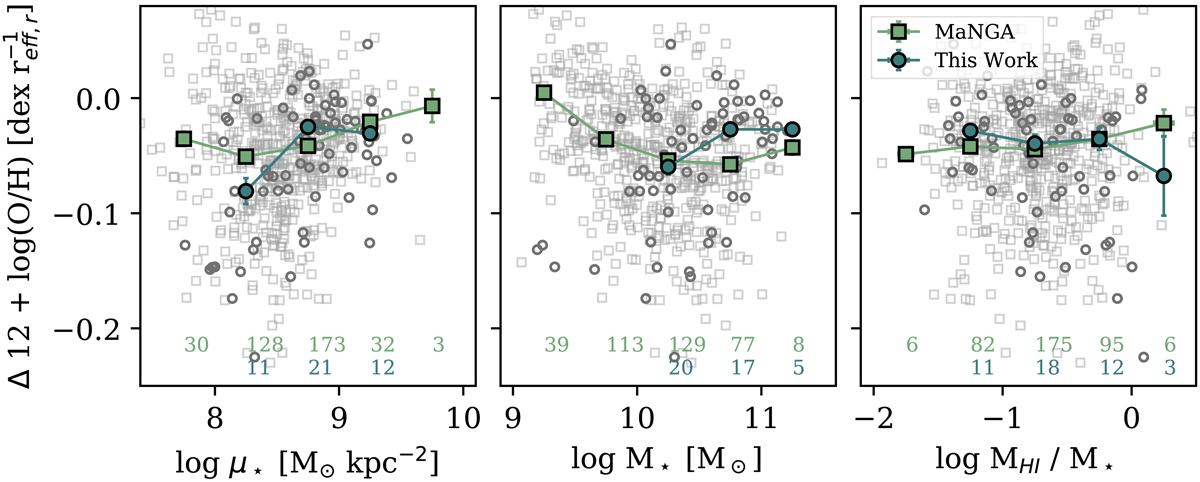
Fig. 8.

Comparison with MaNGA: all panels show the metallicity gradient as a function of global properties: log μ⋆, log M⋆, and log fHI (from left to right). Trimmed mean gradients agree with median gradients within the standard deviation (error bars), thus we only show the median gradients. Grey, open squares in the background show individual MaNGA metallicity gradients and green, filled squares show MaNGA median gradients. Grey, open circles in the background, and teal filled circles show the data from this work for the case that metallicity gradients were measured from profiles without radial data points inside of 0.5 reff. The bins within which median gradients were measured, were set to be equidistant in order to mitigate any effects of different distributions of the global properties. We note that we use the M13 O3N2 calibration in this figure.
Current usage metrics show cumulative count of Article Views (full-text article views including HTML views, PDF and ePub downloads, according to the available data) and Abstracts Views on Vision4Press platform.
Data correspond to usage on the plateform after 2015. The current usage metrics is available 48-96 hours after online publication and is updated daily on week days.
Initial download of the metrics may take a while.


