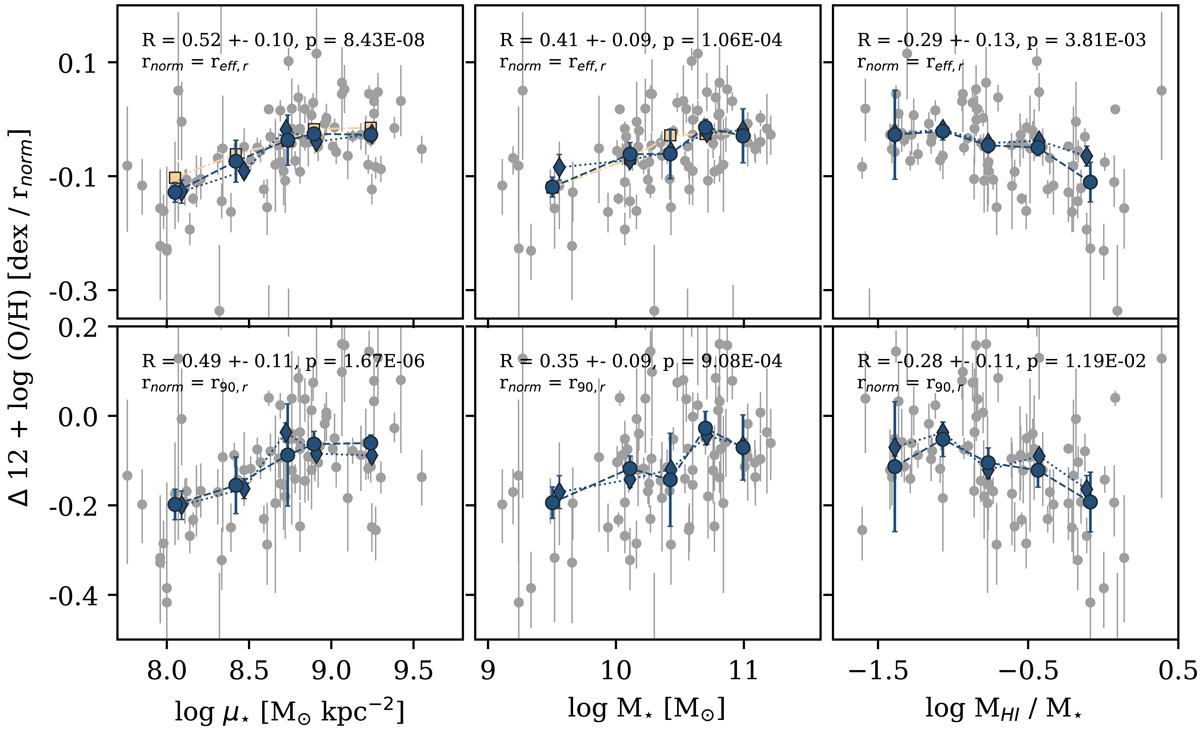
Fig. 6.

Metallicity gradients shown as a function of stellar mass surface density (left), stellar mass (middle), and atomic gas mass fraction (right). Coloured circles connected with dashed lines present the median gradient of individual profiles. The error bars in y-direction give the bootstrapping error. Coloured diamonds connected by dotted lines show the metallicity gradient of the stacked profiles. The grey data points in the background represent the metallicity gradients measured per galaxy. From top to bottom: the radius used when fitting the gradient is normalised by reff and r90. The text in the upper part of each panel provides the Spearman R correlation coefficient for all galaxies, its bootstrapping error and the corresponding p-value. The coefficient is calculated between the data points for individual galaxies rather than the binned values. Where available, the yellow squares show an expected average metallicity gradient; see the text for more details.
Current usage metrics show cumulative count of Article Views (full-text article views including HTML views, PDF and ePub downloads, according to the available data) and Abstracts Views on Vision4Press platform.
Data correspond to usage on the plateform after 2015. The current usage metrics is available 48-96 hours after online publication and is updated daily on week days.
Initial download of the metrics may take a while.


