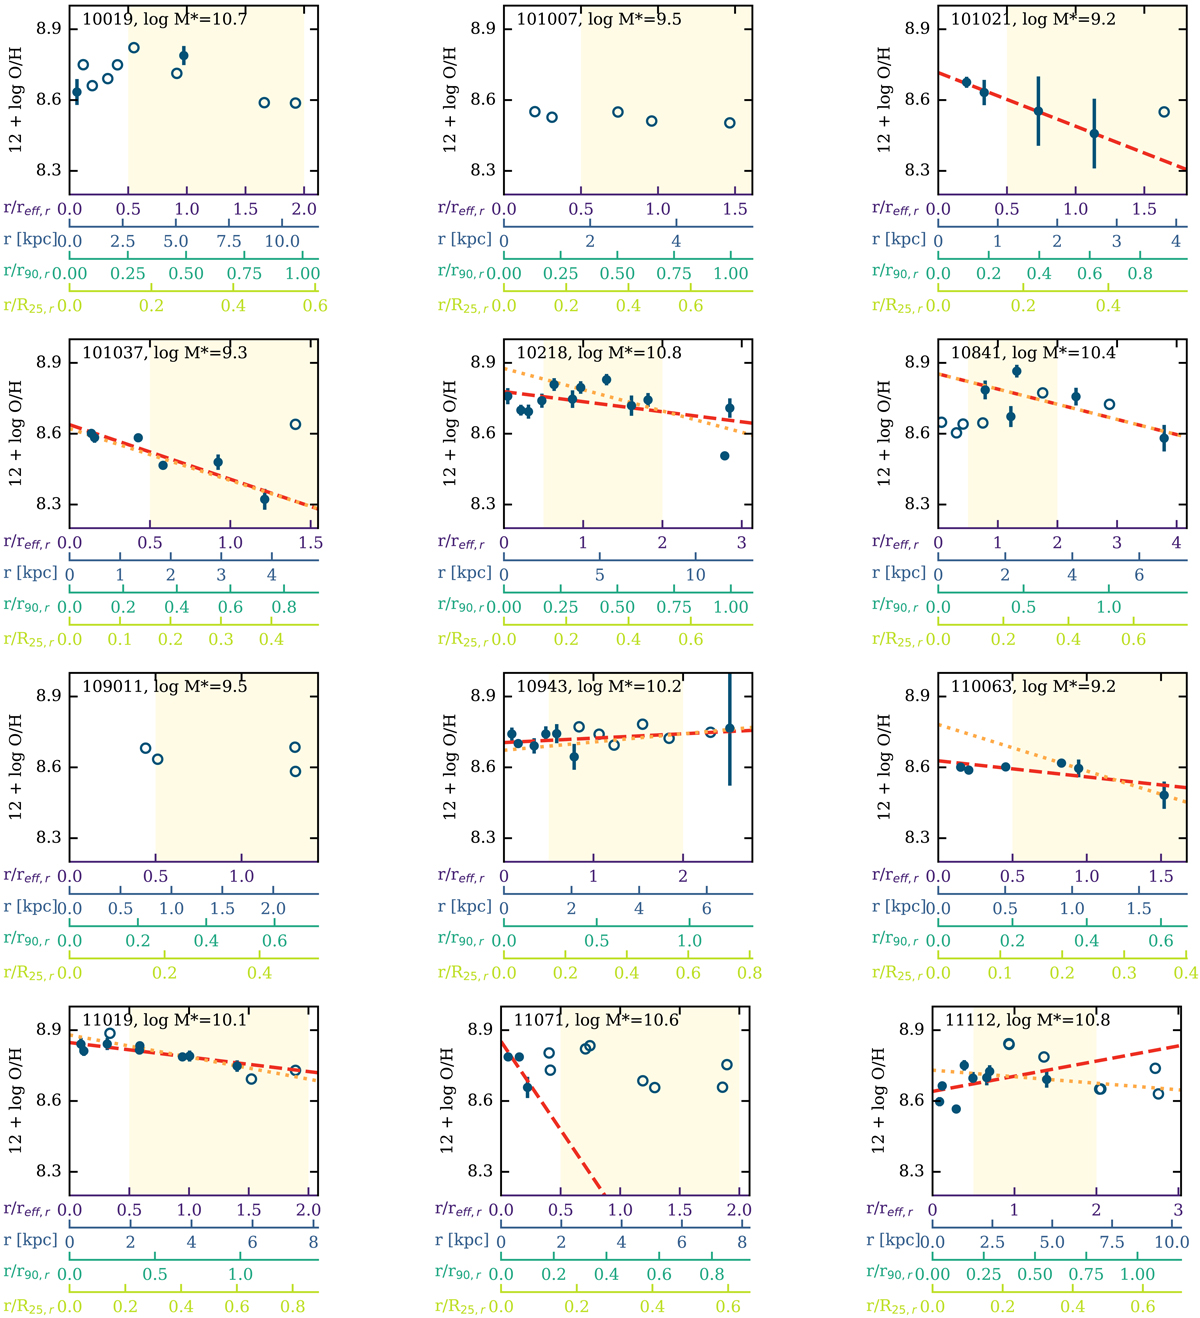
Fig. B.1.

Radial metallicity profiles for the different sample galaxies. In each panel, the metallicity (estimated with the Pettini & Pagel 2004O3N2 method) is shown as a function of radius. On the main x-axis, the radius is normalised by reff, r, additionally we also give the x-axis in units of kpc, normalised by r90, r, r50, r and R25, r for orientation. Filled circles mark all metallicity measurements that meet our quality criteria (see Sect. 3.3) and open circles that measurements that do not meet our criteria. The red dashed line shows the linear fit used to measure the metallicity gradient from the full metallicity profile and the orange dotted line the linear fit used to measure the metallicity gradient without the central 0.5 reff, r. The yellow shaded area, marks the radial regions between 0.5 and 2.0 reff, r, where e. g. publications based on CALIFA and MaNGA data products perform their metallicity gradient measurements. The text in the top right corner gives the GASS ID of the galaxy and the stellar mass.
Current usage metrics show cumulative count of Article Views (full-text article views including HTML views, PDF and ePub downloads, according to the available data) and Abstracts Views on Vision4Press platform.
Data correspond to usage on the plateform after 2015. The current usage metrics is available 48-96 hours after online publication and is updated daily on week days.
Initial download of the metrics may take a while.


