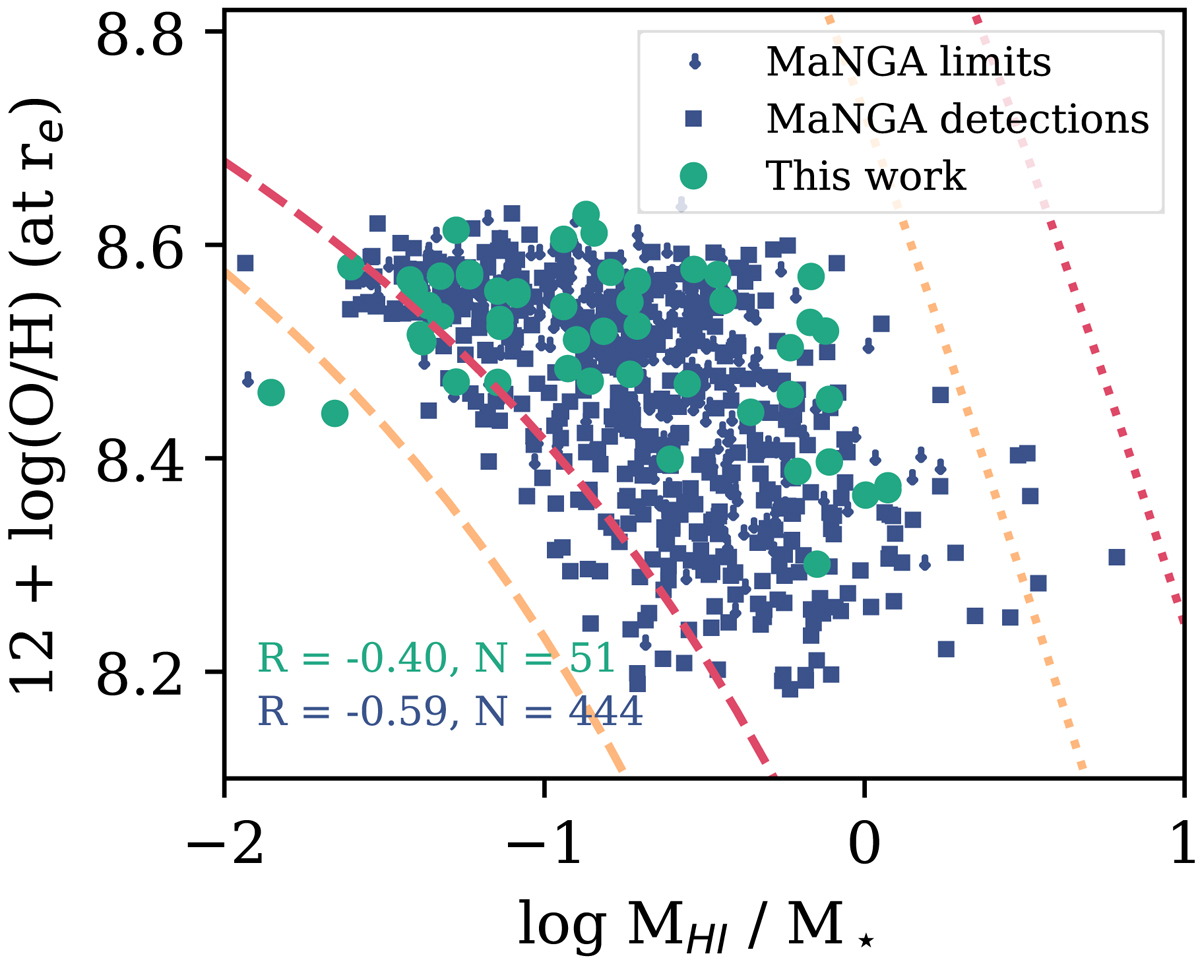
Fig. 11.

Local metallicity at and around ±10 percent of the effective radius as a function of the global H I mass fraction for MaNGA (dark blue squares and arrows) and our sample (green circles), respectively. The numbers in the bottom left provide the Spearman correlation coefficient R and the number of galaxies used to calculated the statistic. For MaNGA we only used H I detections in the computation of R. The yellow and red line show our model for different ratios of H I to stellar radius, namely, 3.3 and 5.6, respectively. The underlying model of the dashed lines assumes an effective yield of 0.00268 (Pilyugin et al. 2004) and the dotted lines a stellar yield of 0.037 (Vincenzo et al. 2016 and references therein). We note that we use the M13 O3N2 calibration in this figure.
Current usage metrics show cumulative count of Article Views (full-text article views including HTML views, PDF and ePub downloads, according to the available data) and Abstracts Views on Vision4Press platform.
Data correspond to usage on the plateform after 2015. The current usage metrics is available 48-96 hours after online publication and is updated daily on week days.
Initial download of the metrics may take a while.


