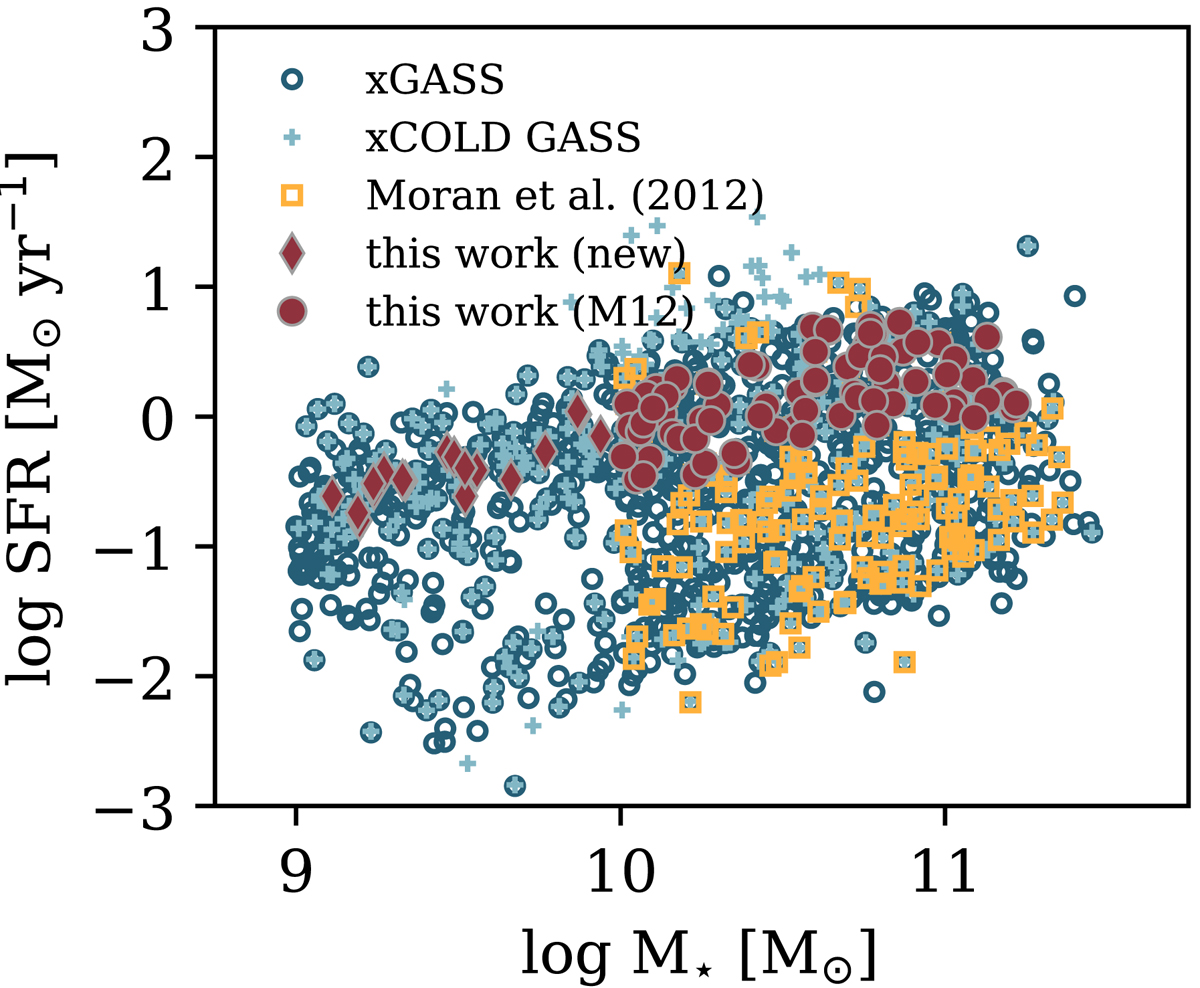
Fig. 1.

Distribution of the sample in the stellar mass-SFR plane. Blue open circles represent the xGASS sample, light blue crosses the xCOLD GASS sample, and yellow open squares mark galaxies that were included in the M12 analysis but not in this work. Galaxies marked with a red symbol are included in the sample used in this paper, where diamonds represent galaxies with new observations and filled circles galaxies with observations from M12.
Current usage metrics show cumulative count of Article Views (full-text article views including HTML views, PDF and ePub downloads, according to the available data) and Abstracts Views on Vision4Press platform.
Data correspond to usage on the plateform after 2015. The current usage metrics is available 48-96 hours after online publication and is updated daily on week days.
Initial download of the metrics may take a while.


