Fig. 9.
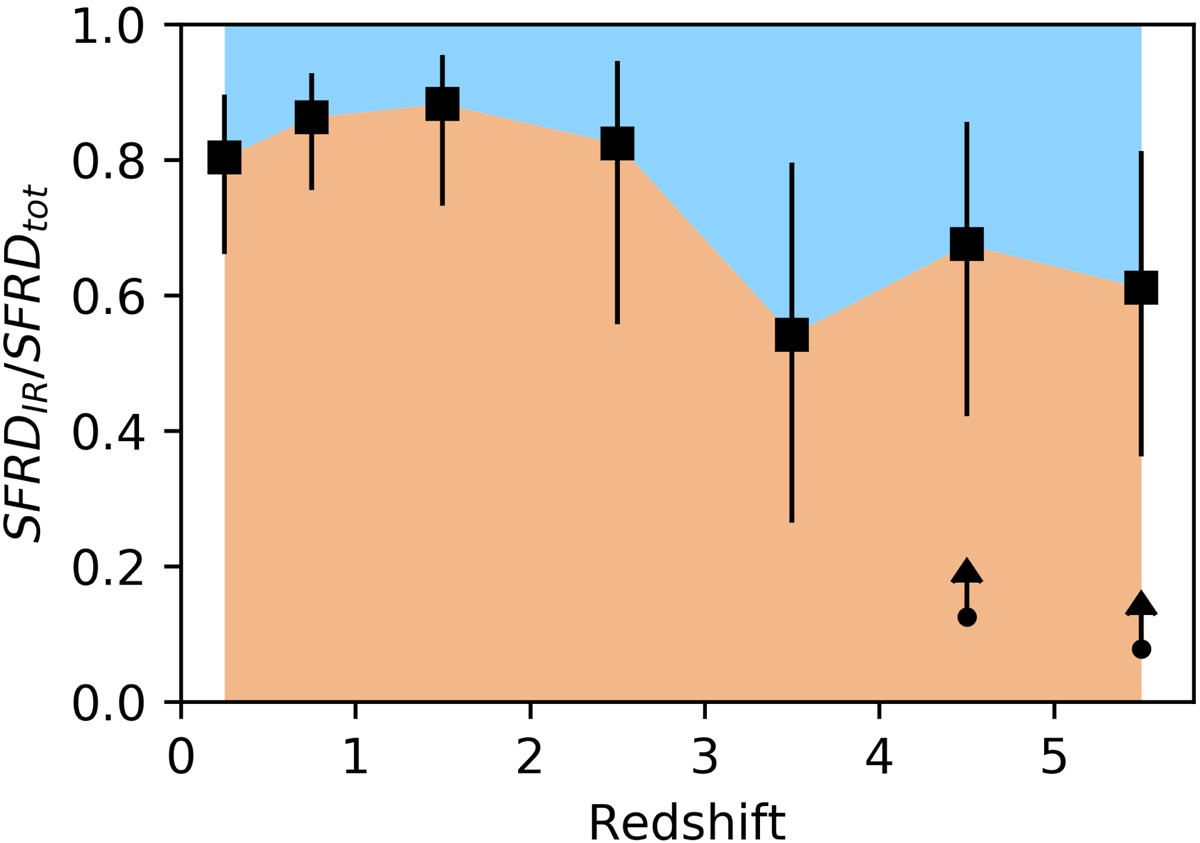
Evolution of the fraction of the dust obscured SFRDIR as a function of redshift. The arrows show the lower limits obtained using the lower limits discussed in Sect. 4.3.1. The points at z < 4 are obtained using a compilation of the literature from Fig. 7. The points at z > 4 are obtained using the UVLF+GSMF combined measurements from Table 2.
Current usage metrics show cumulative count of Article Views (full-text article views including HTML views, PDF and ePub downloads, according to the available data) and Abstracts Views on Vision4Press platform.
Data correspond to usage on the plateform after 2015. The current usage metrics is available 48-96 hours after online publication and is updated daily on week days.
Initial download of the metrics may take a while.