Fig. 8.
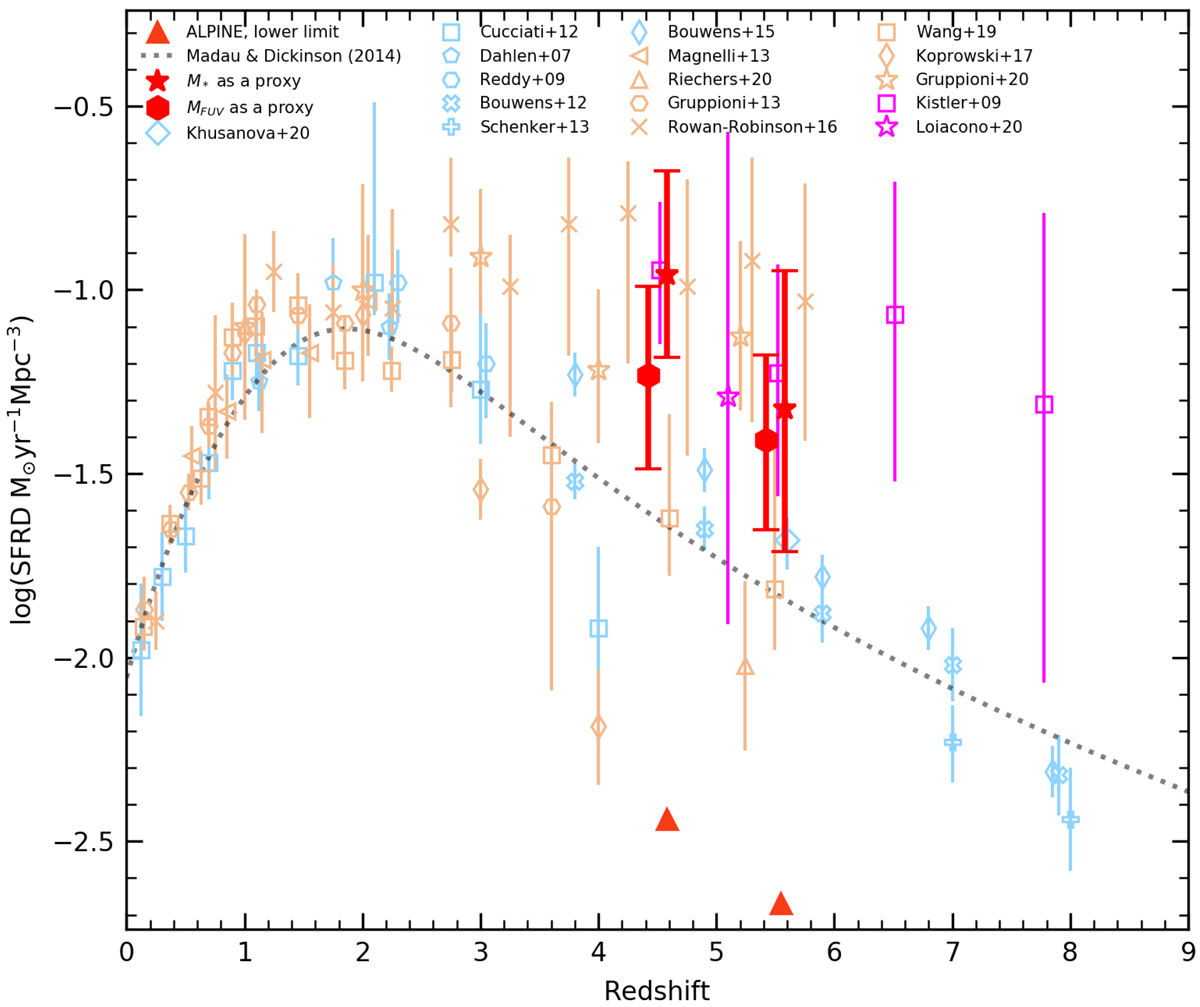
Evolution of SFRDIR and SFRDFUV, uncorr with redshift. The red symbols are the SFRDIR, derived in this paper. Small offsets of ±0.08 are applied to their redshift for clarity. The triangles are the lower limits for SFRDIR derived in Sect. 4.3.1. The blue symbols are SFRDFUV, uncorr derived from the FUV data (Cucciati et al. 2012; Dahlen et al. 2007; Reddy & Steidel 2009; Bouwens et al. 2012, 2015b; Schenker et al. 2013; Pelló et al. 2018; Khusanova et al. 2020), orange symbols are SFRDIR from Magnelli et al. (2013), Gruppioni et al. (2013, 2020), Rowan-Robinson et al. (2016), Koprowski et al. (2017), Wang et al. (2019a) and Riechers et al. (2020). Orange lines are the fits of SFRDIR evolution from Koprowski et al. (2017) and Maniyar et al. (2018).
Current usage metrics show cumulative count of Article Views (full-text article views including HTML views, PDF and ePub downloads, according to the available data) and Abstracts Views on Vision4Press platform.
Data correspond to usage on the plateform after 2015. The current usage metrics is available 48-96 hours after online publication and is updated daily on week days.
Initial download of the metrics may take a while.