Fig. 7.
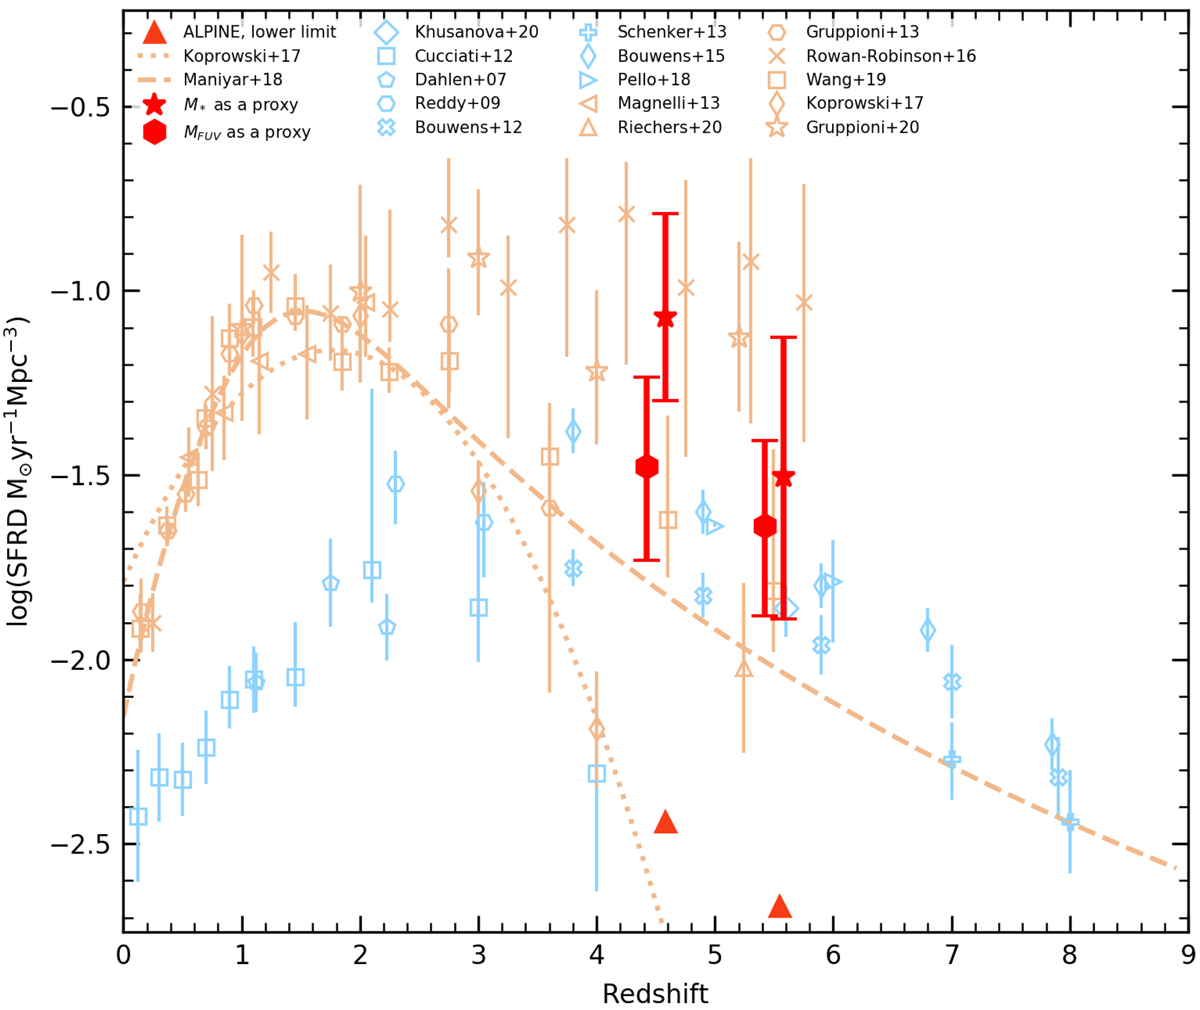
Evolution of the total SFRD (Eq. (2)) with redshift. The red symbols are the total SFRDs, derived in this paper. Small offsets of ±0.08 are applied to their redshift for clarity. The triangles are the lower limits for SFRDIR derived in Sect. 4.3.1. The blue symbols are dust-corrected SFRD derived from the FUV data (Cucciati et al. 2012; Dahlen et al. 2007; Reddy & Steidel 2009; Bouwens et al. 2012, 2015b; Schenker et al. 2013; Pelló et al. 2018; Khusanova et al. 2020), orange symbols are derived from reradiated dust emission from forming stars as measured from the IR (Magnelli et al. 2013; Gruppioni et al. 2013, 2020; Rowan-Robinson et al. 2016; Koprowski et al. 2017; Wang et al. 2019a; Riechers et al. 2020). The magenta points are from other SFR tracers: [CII] luminosity function based on the ALPINE field sample of Loiacono et al. (2021) and number counts of γ-ray bursts (Kistler et al. 2009). The dotted line is the fit of SFRD evolution from Madau & Dickinson (2014).
Current usage metrics show cumulative count of Article Views (full-text article views including HTML views, PDF and ePub downloads, according to the available data) and Abstracts Views on Vision4Press platform.
Data correspond to usage on the plateform after 2015. The current usage metrics is available 48-96 hours after online publication and is updated daily on week days.
Initial download of the metrics may take a while.