Fig. 5.
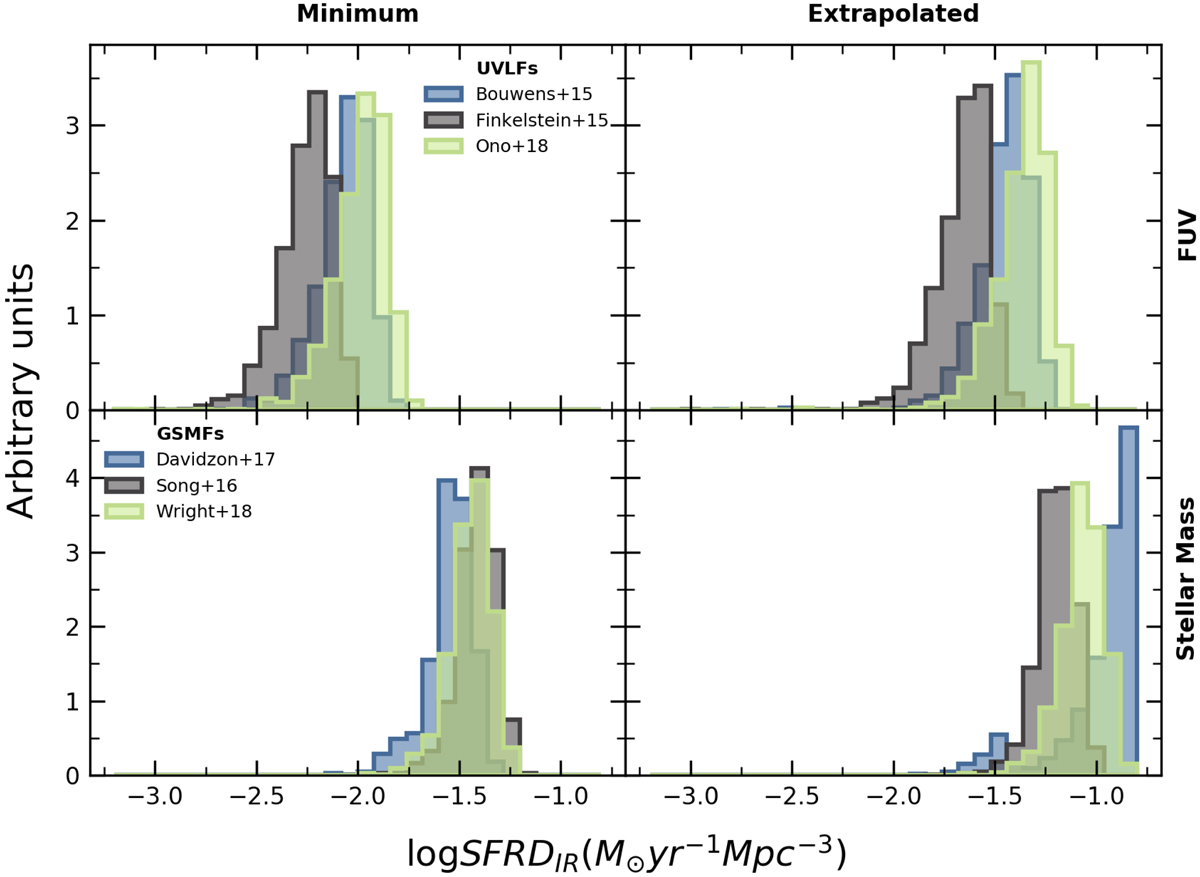
Probability distribution of the SFRDIR at redshift z ∼ 4.5. All distributions are derived with the same relations between the stellar mass (bottom panels) and FUV magnitudes (top panels). The minimum is derived in the observed by ALPINE range of stellar masses and FUV magnitudes and is shown on the left panels. The SFRDs from extrapolated relation are shown on the right panels. Different colors correspond to different GSMFs and UVLFs (Bouwens et al. 2015b; Finkelstein et al. 2015; Ono et al. 2018; Davidzon et al. 2017; Song et al. 2016; Wright et al. 2018).
Current usage metrics show cumulative count of Article Views (full-text article views including HTML views, PDF and ePub downloads, according to the available data) and Abstracts Views on Vision4Press platform.
Data correspond to usage on the plateform after 2015. The current usage metrics is available 48-96 hours after online publication and is updated daily on week days.
Initial download of the metrics may take a while.