Fig. 4.
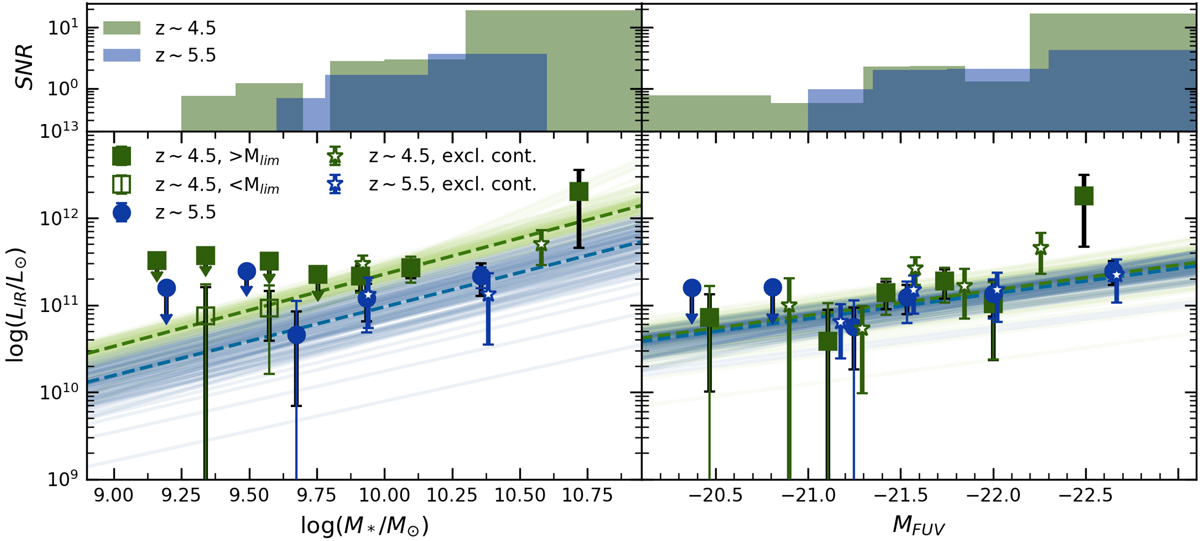
Average infrared luminosity versus proxy (stellar mass as a proxy on the left panel and FUV magnitude on the right). The green squares and blue circles are the average IR luminosities on the stacks at z ∼ 4.5 and z ∼ 5.5, respectively. The black error bars show the population variance (σpop), the colored error bars show the photometric noise (σphot, see Eq. (1), Sect. 3.1). The open squares are the flux measurements on stacks below mass limit Mlim. The stars are the results on stacks excluding the galaxies with signs of possible contamination by a close companion. The green and blue dashed lines are the best fits of the relation and the thin lines of corresponding color are the MCMC chain realizations of the fit. Top panels: S/N on each stack.
Current usage metrics show cumulative count of Article Views (full-text article views including HTML views, PDF and ePub downloads, according to the available data) and Abstracts Views on Vision4Press platform.
Data correspond to usage on the plateform after 2015. The current usage metrics is available 48-96 hours after online publication and is updated daily on week days.
Initial download of the metrics may take a while.