Fig. 3.
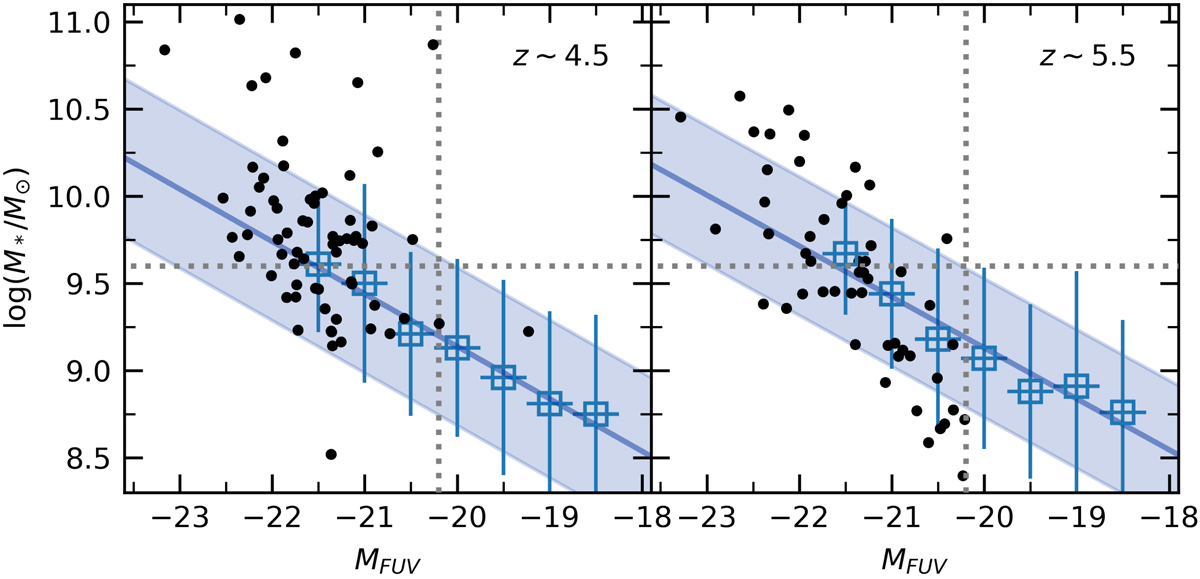
Stellar mass versus FUV magnitude. The black circles are ALPINE targets as measured by Faisst et al. (2020). The open squares are measurements from Salmon et al. (2015). The solid blue line is the fit to the measurements by Salmon et al. (2015) and the shaded areas are 1σ uncertainties. The vertical dotted line shows the FUV luminosity cut used in selecting galaxies. The vertical dotted lines show the mass limits below which the flux measurements are considered to be upper limits. Left panel: z ∼ 4.5 redshift bin and right panel: z ∼ 5.5 bin.
Current usage metrics show cumulative count of Article Views (full-text article views including HTML views, PDF and ePub downloads, according to the available data) and Abstracts Views on Vision4Press platform.
Data correspond to usage on the plateform after 2015. The current usage metrics is available 48-96 hours after online publication and is updated daily on week days.
Initial download of the metrics may take a while.