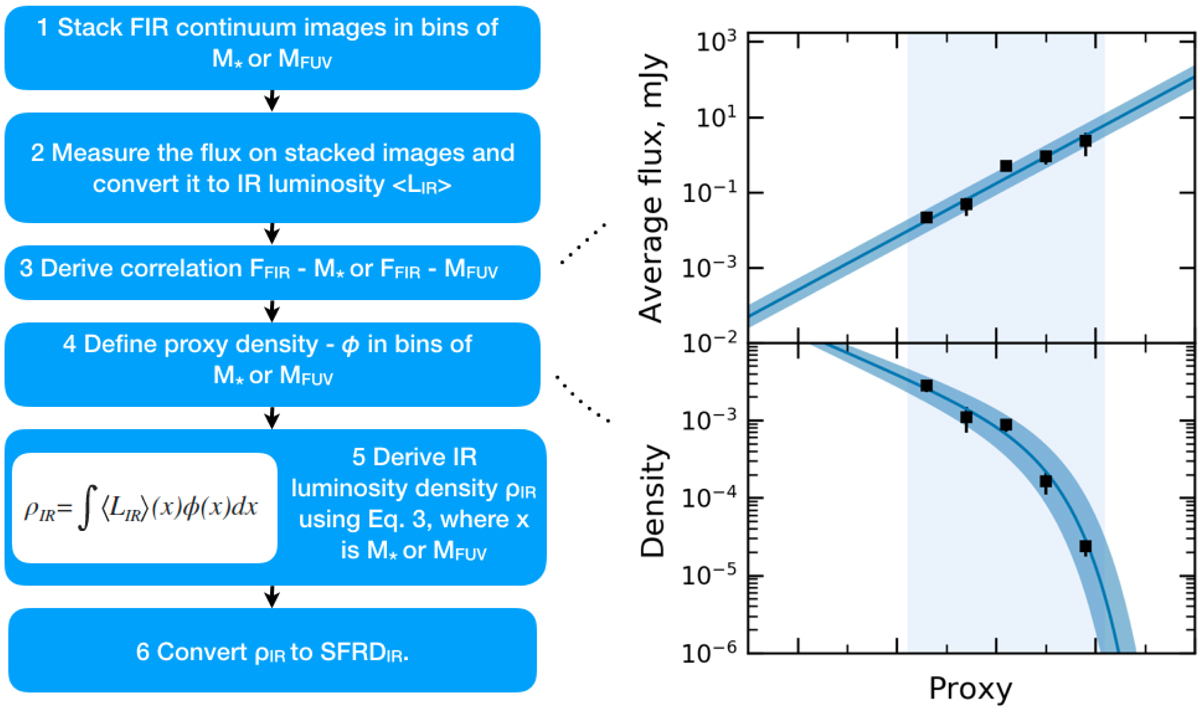
Fig. 2.

Illustration of the method used to determine the SFRDIR. Left panel: steps performed. Right panel: arbitrary proxy density function (UVLF or GSMF) and a power law relation between the property used as a proxy and the FIR flux. The black squares represent measured values and the solid line the fit with uncertainties represented by a shaded region. The vertical shaded regions show the proxy range, in which the data is available for both the power law relation derived from ALPINE and the proxy density function.
Current usage metrics show cumulative count of Article Views (full-text article views including HTML views, PDF and ePub downloads, according to the available data) and Abstracts Views on Vision4Press platform.
Data correspond to usage on the plateform after 2015. The current usage metrics is available 48-96 hours after online publication and is updated daily on week days.
Initial download of the metrics may take a while.


