Fig. 9.
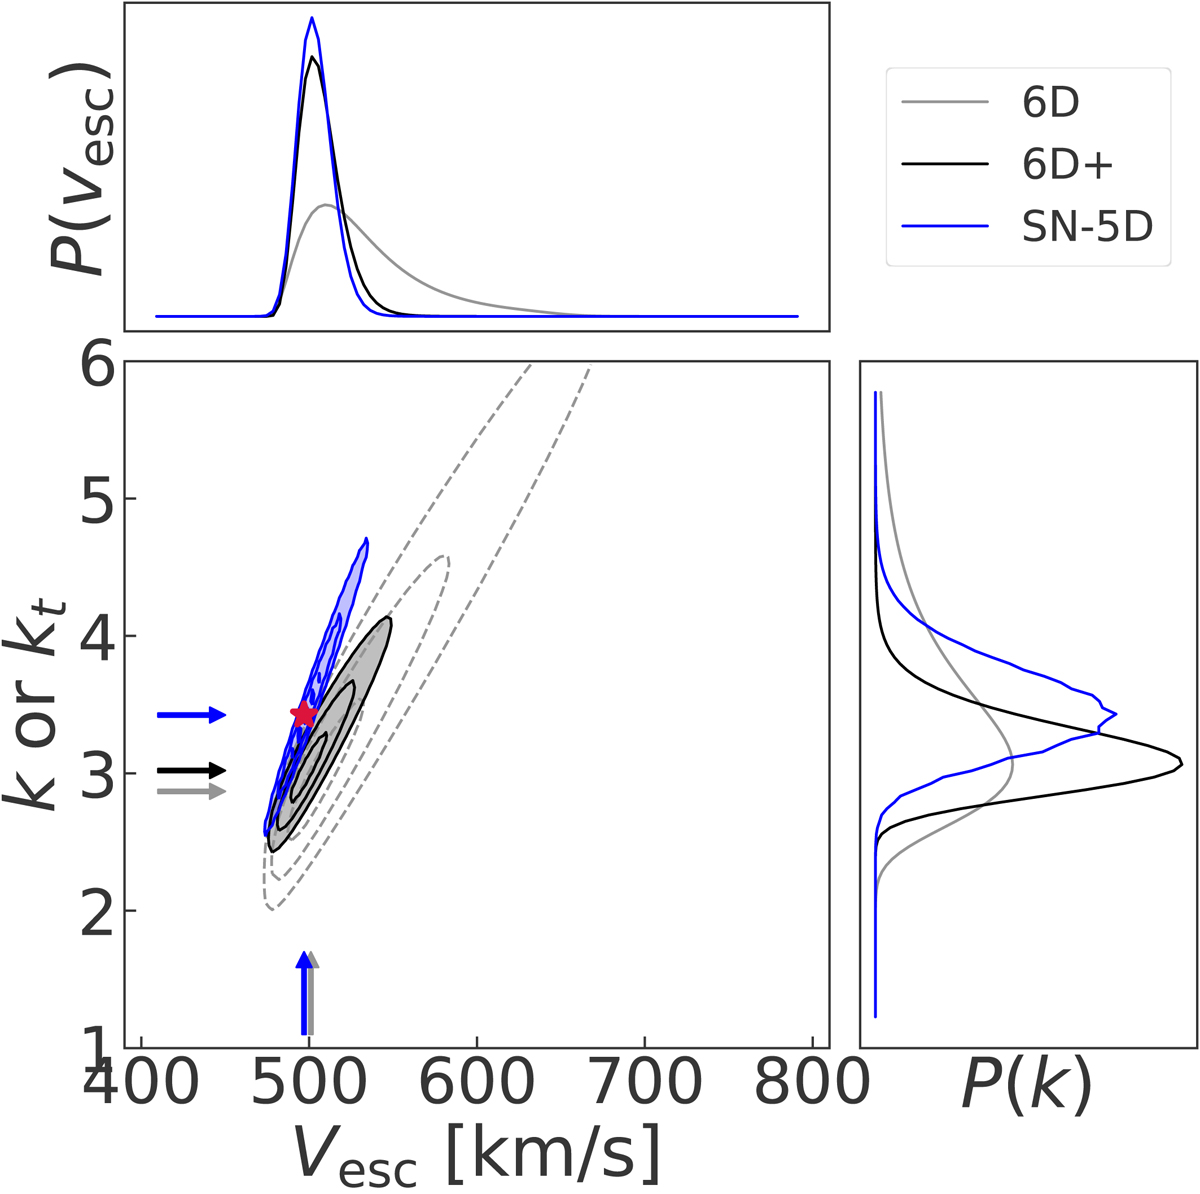
Confidence levels obtained by applying the LT90 method to the 5D and 6D samples in the solar neighbourhood. For each curve the 1, 2, and 3σ levels are shown, and the arrows indicate the maximum probability values. The side panels show the marginalised posterior distributions for P(vesc) and P(k). For the 6D sample we show the results for both the augmented dataset and when using Gaia data alone. For the 5D sample, we recall that the method determines kt, and this is what is shown on the y-axis of the main panel, while the blue curve in the right panel represents P(kt).
Current usage metrics show cumulative count of Article Views (full-text article views including HTML views, PDF and ePub downloads, according to the available data) and Abstracts Views on Vision4Press platform.
Data correspond to usage on the plateform after 2015. The current usage metrics is available 48-96 hours after online publication and is updated daily on week days.
Initial download of the metrics may take a while.