Fig. 12.
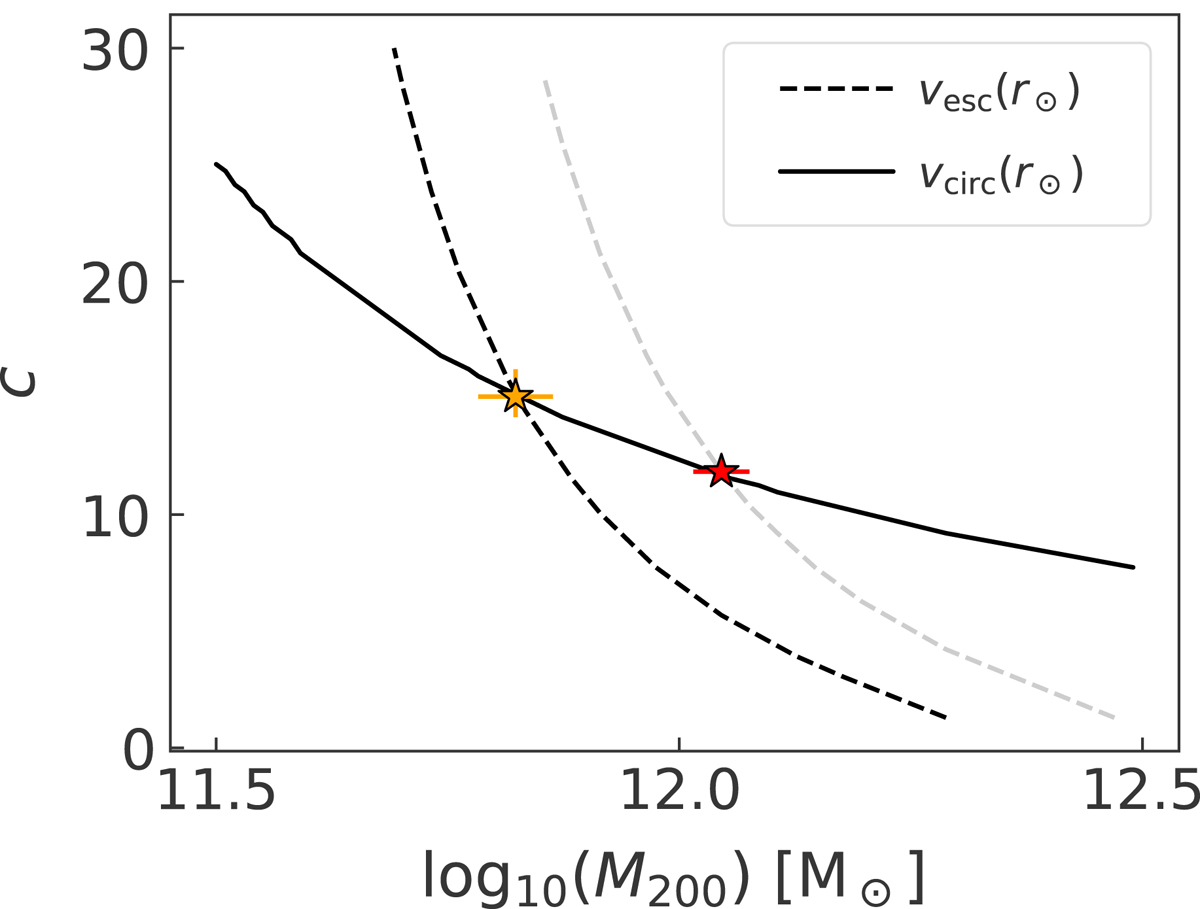
Best-fit combinations of the halo mass and concentration parameter. The orange marker indicates the best-fitting M200 and c parameters, and the red marker shows the best-fitting model after correcting vesc for a 10% offset. The error bars indicate the uncertainty in the halo parameters that is related to 1σ variations in the estimate of vesc.
Current usage metrics show cumulative count of Article Views (full-text article views including HTML views, PDF and ePub downloads, according to the available data) and Abstracts Views on Vision4Press platform.
Data correspond to usage on the plateform after 2015. The current usage metrics is available 48-96 hours after online publication and is updated daily on week days.
Initial download of the metrics may take a while.