Fig. 2.
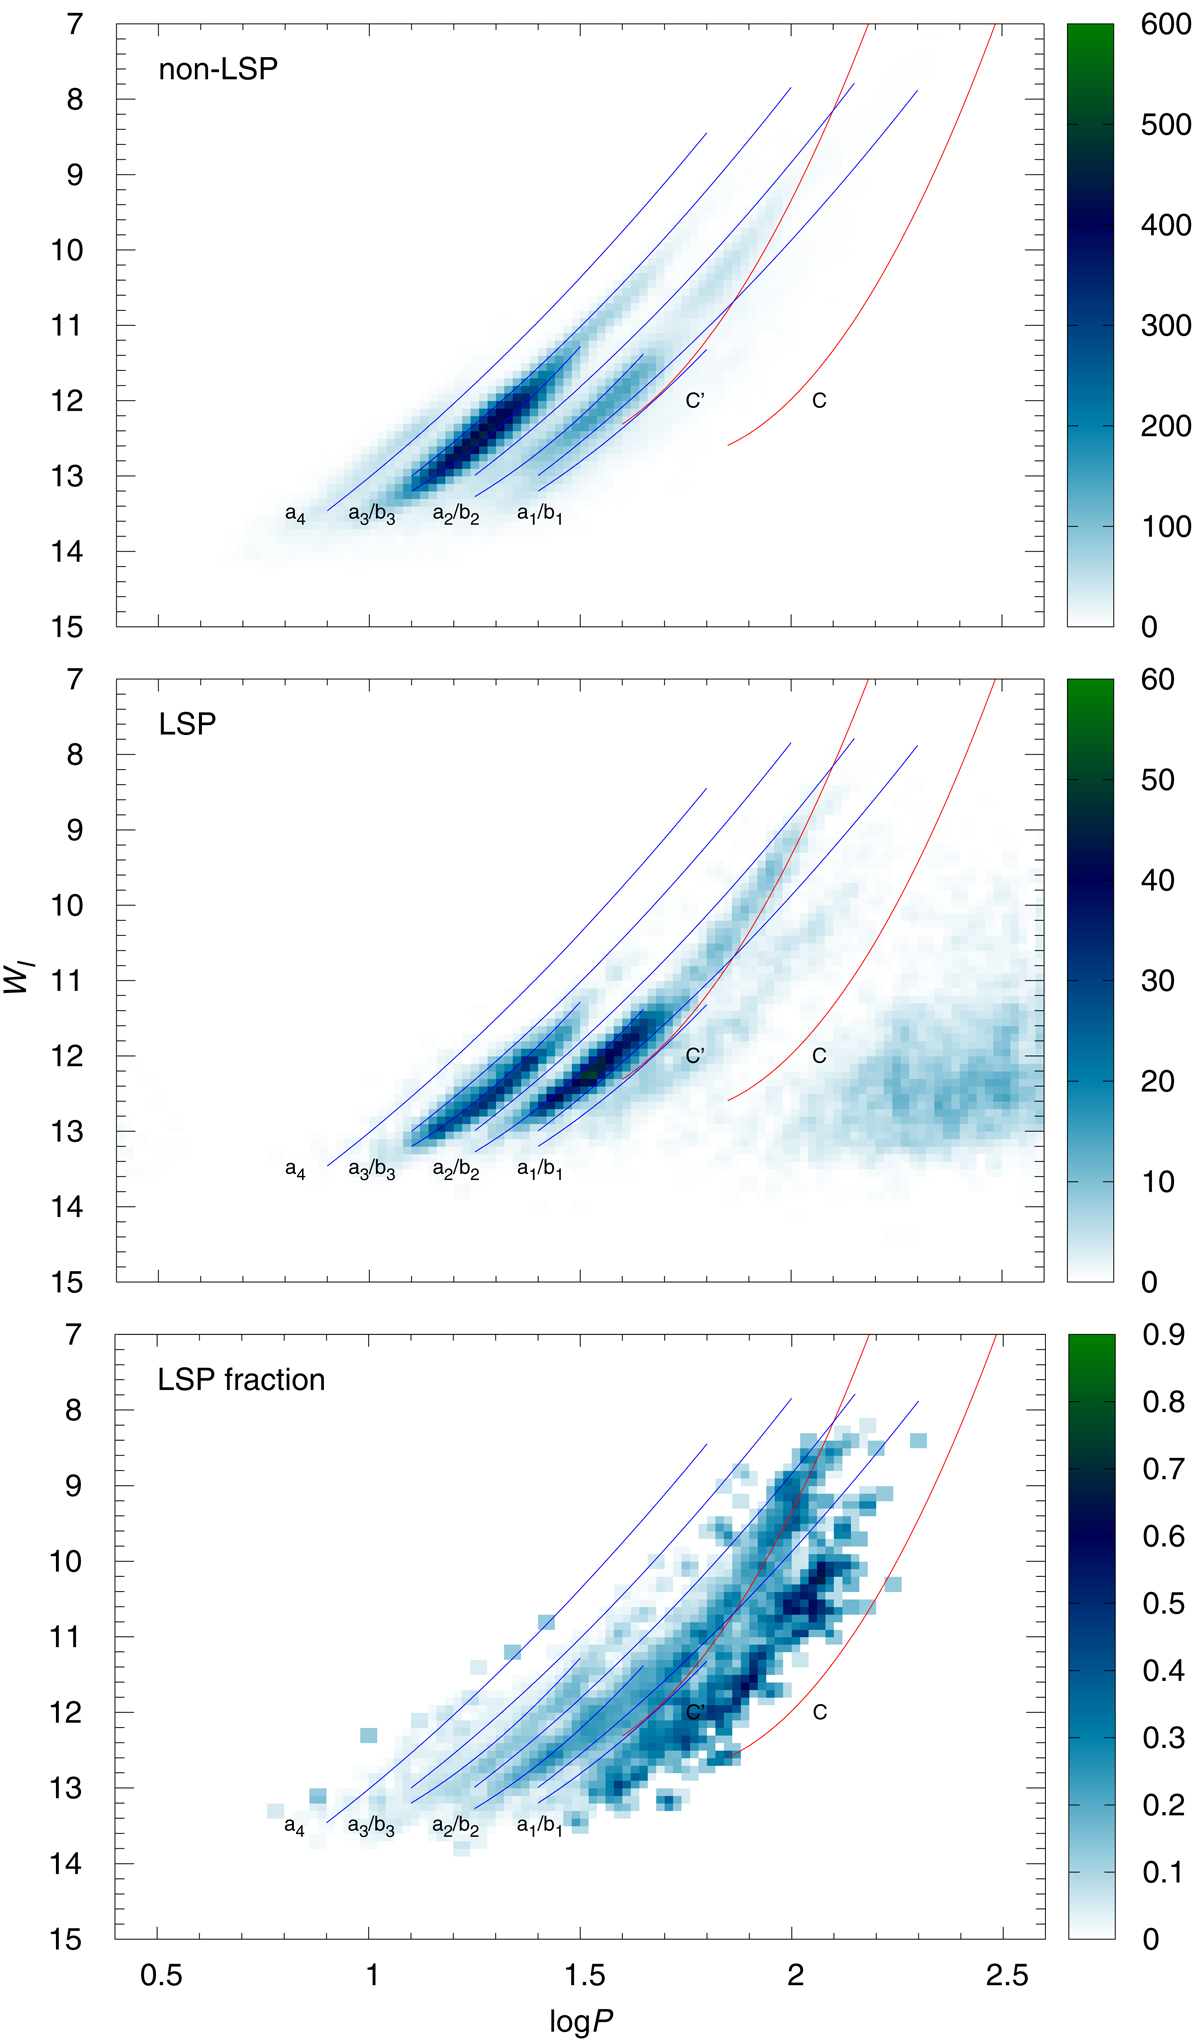
Density map in the PL plane for non-LSP OSARGs – upper panel, LSP OSARGs – middle panel, and the fraction of OSARGs showing LSP – lower panel. Middle and lower panels: the period used for the LSP OSARGs is the pulsational (i.e., second most prominent) period, not the LSP itself. PL relation for OSARGs and SRVs (Soszyński 2007) are marked with blue and red lines respectively.
Current usage metrics show cumulative count of Article Views (full-text article views including HTML views, PDF and ePub downloads, according to the available data) and Abstracts Views on Vision4Press platform.
Data correspond to usage on the plateform after 2015. The current usage metrics is available 48-96 hours after online publication and is updated daily on week days.
Initial download of the metrics may take a while.