| Issue |
A&A
Volume 649, May 2021
|
|
|---|---|---|
| Article Number | A27 | |
| Number of page(s) | 26 | |
| Section | Extragalactic astronomy | |
| DOI | https://doi.org/10.1051/0004-6361/202038591 | |
| Published online | 06 May 2021 | |
Nowhere to hide: Radio-faint AGN in the GOODS-N field
II. Multi-wavelength AGN selection techniques and host galaxy properties
1
Kapteyn Astronomical Institute, University of Groningen, 9747 AD, Groningen, The Netherlands
2
Department of Physics, University of Pretoria, Lynnwood Road, Hatfield, Pretoria 0083, South Africa
e-mail: This email address is being protected from spambots. You need JavaScript enabled to view it.
3
Jodrell Bank Centre for Astrophysics, School of Physics & Astronomy, The University of Manchester, Alan Turing Building, Oxford Road, Manchester M13 9PL, UK
4
Leiden Observatory, Leiden University, PO Box 9513, 2300, RA Leiden, The Netherlands
Received:
5
June
2020
Accepted:
14
March
2021
Abstract
Context. Obtaining a census of active galactic nuclei (AGN) activity across cosmic time is critical to our understanding of galaxy evolution and formation. Many AGN classification techniques are compromised by dust obscuration. However, very long baseline interferometry (VLBI) can be used to identify high brightness temperature compact radio emission (> 105 K) in distant galaxies that can only be reliably attributed to AGN activity.
Aims. We present the second in a series of papers dealing with the compact radio population in the GOODS-N field. This paper reviews the various multi-wavelength data and AGN classification techniques in the context of a VLBI-detected sample and use these to investigate the nature of the AGN as well as their host galaxies.
Methods. Multi-wavelength data from radio to X-ray were compiled for the GOODS-N AGN sample, and fourteen widely used multi-wavelength AGN classification schemes were tested. We discuss and compare the various biases that affect multi-wavelength and VLBI selection. We use the physical interpretation to imply the nature of VLBI-selected AGN and their hosts.
Results. Firstly, we find that no single identification technique can identify all VLBI objects as AGN. Infrared colour–colour selection is most notably incomplete. However, the usage of multiple classification schemes can identify all VLBI-selected AGN, independently verifying similar approaches used in other deep field surveys. In the era of large area surveys with instruments such as the SKA and ngVLA, multi-wavelength coverage, which relies heavily upon observations from space, is often unavailable. Therefore, VLBI remains an integral component in detecting AGN of the jetted efficient and inefficient accretion types. Secondly, a substantial fraction (46%) of the VLBI AGN have no X-ray counterpart, which is most likely due to lack of sensitivity in the X-ray band. Thirdly, a high fraction of the VLBI AGN reside in low or intermediate redshift dust-poor early-type galaxies. These most likely exhibit inefficient accretion. Fourthly, A significant fraction of the VLBI AGN reside in symbiotic dusty starburst – AGN systems. Finally, in the appendix, we present an extensive compilation of the multi-wavelength properties of all the VLBI AGN in GOODS-N.
Key words: radio continuum: galaxies / galaxies: active / techniques: high angular resolution / techniques: interferometric
© ESO 2021
1. Introduction
Deep, wide-field surveys of the sky have yielded a profound understanding as to the evolution of galaxies. Surveys at longer wavelengths, especially radio and far-infrared (FIR), play a crucial role here as dust and its attendant obscuration is a ubiquitous partner to the merger activity associated with galaxy growth (e.g., Zinn et al. 2011). It is believed that minor mergers and/or cold gas accretion, rather than major mergers, are responsible for the growth of these systems (e.g., Elbaz et al. 2011). Given the well-established scaling relations, super-massive black holes (SMBH) must have been in place early and their episodic growth must manifest through accretion-related radiation.
A widespread symbiotic occurrence of star formation and super-massive black hole (SMBH) growth at high redshifts is expected. Indeed, this is seen in radio and FIR observations of faint X-ray selected active galactic nuclei (AGN; e.g., Padovani et al. 2009; Mullaney et al. 2012; Rodighiero et al. 2015) and in radio-loud AGN (e.g., Podigachoski et al. 2015). Recent literature has reached a consensus that star-formation (SF) and SMBH accretion were more common in the past and peak at redshifts of around 2 (see Madau & Dickinson 2014, and references therein).
There are at least two important issues that still need to be addressed: first, the nature of galaxies with dust-obscured AGN and second, the interplay between nuclear activity and star formation. To achieve this we require a complete census of AGN activity. X-ray surveys have proved to be a particularly powerful method of selecting both obscured and un-obscured AGN to faint flux densities and high redshifts. However, Compton-thick AGN, where the X-ray emission below 10 keV are attenuated by obscuration with column densities larger than 5 × 1024 cm−2 have been routinely missed by these surveys (e.g., Hasinger 2008). A recent study by Mateos et al. (2017), using XMM-Newton, predicted that Compton-thick AGN may account for as much as  of the total AGN population, and so the majority of luminous accreting black holes at z < 1 are so embedded that they remain undetected by current wide-area X-ray surveys. Synthesis modelling of the X-ray background (XRB) seems to confirm this, revealing the need for a large population of heavily-obscured AGN in order to replicate the high energy peak (∼30 keV) seen in the unresolved XRB (Gilli et al. 2007; Ballantyne et al. 2011).
With the operational capabilities provided by the Spitzer and Herschel telescopes, considerable efforts have been made to identify obscured AGN activity by using the infrared (IR) bands. In the mid-IR (MIR), a typical star-forming galaxy has a dip in the IR spectral energy distribution (SED) between the long wavelength emission from star formation heated dust (typically λ ∼ 100 μm with dust temperatures of 25 − 50 K) and the 1.6 μm stellar bump. If an AGN is present, dust in the torus surrounding the central black hole will be heated to 200 − 1500 K due to the absorption of ultra-violet (UV) photons. These are then emitted into the MIR bands (5 − 40 μm; e.g., Feltre et al. 2013). This can result in a flattening of IR SED between SF heated dust and stellar emission (e.g., Mullaney et al. 2011; Donley et al. 2012). IR surveys have tried to identify this hot AGN-related dust component from stellar emission using various methods, such as Spitzer IRAC power law emission fitting (Alonso-Herrero et al. 2006), Spitzer IRAC/MIPS colour–colour diagnostics (e.g., Lacy et al. 2004, 2007; Donley et al. 2012; Kirkpatrick et al. 2012), and WISE colour–colour diagnostics (e.g., Jarrett et al. 2011; Stern et al. 2012; Mateos et al. 2012). However, it has been noted that SF related emission can dominate across the entire IR band that can mask the presence of AGN-induced hot dust (e.g., Farrah et al. 2003).
A potentially powerful approach comes in the form of radio observations, that provide a dust-independent window into the obscured and un-obscured AGN populations. At high flux densities (> mJy), the radio population is dominated by the powerful radio-loud population of large (≫kpc) extended radio galaxies and quasars powered by AGN. Towards fainter flux densities (< mJy) the radio population transitions into a dominant population of star-forming galaxies and ‘non-jetted’ AGN, whose radio emission is often confined to a compact core (see Padovani 2016, and references therein). These pose a problem because the majority of deep radio surveys are conducted at low (∼arcsecond) resolutions, corresponding to > kpc scales in distant galaxies. As a result, synchrotron emission from AGN activity is often merged with SF-related emission. To disentangle these contributions and to isolate the AGN-related radio emission, various approaches can be used.
The first is to use the well known FIR radio correlation (FIRRC). This exists in star-forming galaxies because radio emission is intimately correlated with the FIR due to their mutual origin in active high-mass star-forming regions. This correlation is found to hold at high redshifts (Yun et al. 2001; Garrett 2002; Sargent et al. 2010; Thomson et al. 2014; Pannella et al. 2015; Magnelli et al. 2015; Delhaize et al. 2017; Algera et al. 2020a), thus any AGN activity can be identified by deviations from this correlation. Here the AGN produces the excess radio emission (e.g., Donley et al. 2005; Del Moro et al. 2013). In the absence of reliable FIR observations, MIR bands such as the Spitzer MIPS 24 μm can be used as a proxy to great effect (e.g., Appleton et al. 2004; Chi et al. 2013). Again though this method only works when the AGN is the dominant source of the total radio emission, so any weak embedded AGN can be hidden behind radio emission originating from stellar processes.
A possible solution is to use Very Long Baseline Interferometry (VLBI). The sparsity of a VLBI array means that it is only sensitive to compact,‘point-like’, radio sources that have brightness temperatures in excess of 105 K. Even the most luminous starburst galaxies have brightness temperatures less than 105 K meaning that a VLBI detection is a reliable indicator of AGN activity at high redshift (e.g., Condon et al. 1982; Kewley et al. 2000; Middelberg et al. 2011). In recent years, technological developments have permitted degrees of the sky to be surveyed at high resolution, thus the use VLBI as a dust-independent tracer of AGN activity is now finally possible.
This study, the second in a series dealing with the ultra-faint radio population in the Great Observatories Origins Deep Survey-North field (GOODS-N; Giavalisco et al. 2004), aims to use a VLBI-selected sample of AGN to compare, contrast and test multi-wavelength AGN classification techniques. These shall be used to infer the nature of VLBI-selected AGN.
The paper is organised as follows. In Sect. 2, we introduce the various multi-wavelength data and catalogues. We investigate the performance of multiple AGN selection techniques in the context of our VLBI sample ranging from the radio to X-ray in Sect. 3. In Sect. 4, we compare the various classification methods, including their biases and limitations, and we infer what these imply about the nature of VLBI-AGN. We summarise our findings in Sect. 5, and provide detailed descriptions of the individual VLBI-selected AGN and their hosts in Appendix A.
Throughout the paper we use the following standards.
-
A spatially-flat 6-parameter ΛCDM cosmology with H0 = 67.8 ± 0.9 km s−1 Mpc−1, Ωm = 0.308 ± 0.012 and ΩΛ = 0.692 ± 0.012 (Planck Collaboration XIII 2016).
-
The convention Sν ∝ να, where Sν is the integrated flux density and α is the intrinsic source spectral index.
-
The subscripts V and AB correspond to the Vega and AB magnitude systems, respectively.
2. Observations, data, and catalogues
The GOODS-N field covers approximately 160 arcmin2 and is centred upon the Hubble Deep Field-North (HDF-N; 12h36m, 62° 14′). The field constitutes some of the deepest multi-wavelength data including Hubble Space Telescope (HST), Chandra, Spitzer, Herschel, UBVRIJHK photometry and spectroscopy along with deep radio data from 1 to 10 GHz. As a useful guide, the data used in the subsequent analyses is presented in Table 1 and the field-of-view (FoV) of a sub-set of these data is presented in Fig. 1.
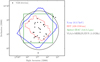 |
Fig. 1. Sub-set of observations in the GOODS-N field illustrating the multi-wavelength coverage. VLBI detections from Paper I are plotted as black circles, and the field-of-view (FoV) of the multiple surveys are colour-coded. The non-uniform coverage across multiple instruments is clearly shown. The FoVs were calculated using an edge detection algorithm on the exposure maps apart from radio observations, which corresponds to the HPBW of a 25 m telescope at 1.5 GHz ( |

Multi-wavelength data available on the GOODS-N field used in these analyses.
2.1. The VLBI-selected AGN sample
For completeness, we summarise the VLBI data used in these analyses here but we refer the reader to Radcliffe et al. (2018, hereafter Paper I) for further details. The GOODS-N field was observed at 1.6 GHz for 24 h, using 10 telescopes of the European VLBI Network (EVN). In total, 31 VLBI sources above a 7σ local rms were detected within the 0.5° FoV. This almost triples the number of VLBI detected sources in this field. The central rms of these observations is approximately 9 μJy beam−1. The redshifts used are presented in Paper I.
For these 31 VLBI detected sources, multi-wavelength data were compiled using a nominal  search radius for the majority of catalogues. In order to prevent mis-identifications, the false identification rate was calculated using a Monte-Carlo approach. For each multi-wavelength catalogue the following was conducted. Firstly, the coordinates of VLBI sources within the catalogue FoV were randomised within the same FoV. These were then cross-matched with the catalogue using the designated search radius. The total number of false matches is then divided by the total number of coordinates to give a false identification rate for one realisation of randomised coordinates. Finally, this is repeated and the average of the false identification rate was calculated. This was repeated 500 times and the average number of false detections was then divided by the total number of VLBI sources, thus providing the false detection rate. For the majority of catalogues, the
  search radius gave false detection rates < 1.5%. It is worth noting that the GOODS-N field does not have uniform multi-wavelength coverage across the FoV. This means that only sub-sets of VLBI sources can be investigated for each AGN classification technique (e.g., see Fig. 1). The following subsections outline the various multi-wavelength catalogues derived for our VLBI-selected sources, the results of which are summarised in Table 2.
Number of multi-wavelength VLBI counterparts and sensitivities of each waveband.
IR AGN colour–colour classification schemes.
2.2. Infrared
Near-IR (NIR) and MIR counterparts for the VLBI sources were derived by cross-matching the Ks selected catalogue of Wang et al. (2010), that includes re-reduced Spitzer IRAC photometry (3.6, 4.5, 5.6 and 8 μm) to within a 1″ radius. The Ks imaging was performed by the WIRCam instrument on the 3.6 m Canada-France-Hawaii Telescope (CFHT) and covers 0.25 deg2 down to limiting AB magnitudes of 24.45 mag (∼0.6 μJy). A total of 30/31 Ks and 23/31 Spitzer IRAC counterparts were found to within the 1″ search radius. To ensure that there is no systematic shift between the two catalogues that could result in false or missing associations, we calculated the median Right Ascension (RA) and Declination (Dec) shift between the VLBI and Wang et al. (2010) catalogue. This was found to be ΔRA = 18.9 ± 69.7 mas and ΔDec = −45.2 ± 57.7 mas. While these offsets are much larger than the VLBI beam (∼ 4−15 mas), they are much smaller than the errors (calculated using the median absolute deviation), and are < 10% of the average seeing ( ) of the Ks band observations. We conclude that there is no significant systematic offset between the NIR and VLBI astrometric frames.
We searched for additional counterparts using the Yang et al. (2014) photometric catalogue, which includes data from the Spitzer Extended Deep Survey (SEDS; Ashby et al. 2013). The Yang et al. (2014) catalogue is astrometrically aligned to the VLA 1.4 GHz positions of Morrison et al. (2010) so no systematic adjustments were required. The Yang et al. (2014) catalogue yielded an additional four IRAC 3.6 μm and 4.5 μm counterparts and five additional IRAC 5.8 μm and 8.0 μm counterparts, while the Ashby et al. (2013) catalogue yielded an additional two IRAC 3.6 μm and 4.5 μm counterparts. In total, there are 30 Ks, 27 IRAC 3.6 μm and 4.5 μm, and 28 IRAC 5.8 μm and 8.0 μm counterparts.
For the Spitzer MIPS 24 μm fluxes, we cross-matched the VLBI positions with catalogue released with the GOODS survey (Dickinson et al. 2003) to within 1″, finding 20 counterparts and 4 upper limits. Again, we checked that there was no astrometric offset between the two catalogues (ΔRA = 26.58 ± 95.80 mas, ΔDec = −17.39 ± 63.30 mas). Additional counterparts were searched for in the Magnelli et al. (2011) catalogue with no additional 24 μm detections found. For each IR AGN classification scheme, we impose the condition that they must be clear detections (i.e., Sν > 3σ) for all bands used in the scheme.
Due to the inhomogeneous coverage provided by Spitzer, further IR counterparts were compiled using the data from the all-sky survey performed by the Wide-field Infrared Survey Explorer (WISE; Wright et al. 2010; Cutri et al. 2014). The entire sky at 3.4, 4.6, 12 and 21 μm was surveyed to 5σ point source sensitivities of at least 0.08, 0.11, 1 and 6 mJy, respectively. In order to compare to WISE colour–colour selection schemes, we cross-matched the WISE all-sky catalogue (Cutri et al. 2014) to the VLBI catalogue. We found that there was no significant offset between the VLBI astrometry and the WISE positions (ΔRA = −0.5 ± 132.7 mas and ΔDec = 45.7 ± 105.31 mas. Despite the large beam size of WISE ( at 3.4 μm), we used a small
  cross-matching radius to ensure that reliable counterparts were found. Using this matching radius, a total of 13 counterparts were found in the WISE 3.6 μm and 4.5 μm bands, two in the WISE 12 μm band and just one in the WISE 22 μm band. The difference between the number of detections is because the point source sensitivity is significantly worse in the 12 and 21 μm bands. Due to the small number of VLBI sources, for all the aforementioned IR cross-matching, we visually checked the quoted coordinates to the HST NIR (F160W; Skelton et al. 2014) or the Ks 2 μm images (Wang et al. 2010) to ensure that the associations were reliable and no counterparts were missing.
We measured FIR fluxes from Herschel PACS and SPIRE imaging of the field, which were undertaken as part of the GOODS-Herschel survey (Elbaz et al. 2011). Due to the large Herschel beam size (∼5″ at 100 μm, rising to ∼35″ at 500 μm), it is important to account for the effects of source blending before measuring the flux densities of our targets. This well-developed deblending technique has already been used to measure flux densities in confusion-limited Herschel SPIRE maps in the Extended Chandra Deep Field South (ECDFS; Swinbank et al. 2014) and Cosmic Evolution Survey (COSMOS; Thomson et al. 2017) fields. Its extension to the GOODS-N field will be presented in detail in a forthcoming paper (Thomson et al., in prep.). For completeness, we briefly summarise the deblending process here.
Before de-blending, a prior catalogue was compiled containing 3848 source positions provided by > 5σSpitzer MIPS 24 μm detections and > 5σ detections from the new 1.5 GHz VLA imaging of GOODS-N (Owen 2018; Muxlow et al. 2020). We then deblended the Herschel PACS and SPIRE maps according to the following process. Firstly, the Herschel PACS/SPIRE maps were regridded and resampled to match the astrometry of the VLA 1.5 GHz continuum image of the field1 (Owen 2018; Muxlow et al. 2020), and the PACS/SPIRE point spread functions (PSFs; Elbaz et al. 2011) were re-sampled to the same pixel scale. Secondly, to check the astrometric alignment of our images, we performed a stacking analysis on the brightest 50 VLA 1.5 GHz sources in each of the 100, 160, 250, 350 and 500 μm images and applied small linear shifts in RA and Dec (in every case  ) to bring the stacked Herschel peaks in to alignment with the centroid of the stacked radio image. Thirdly, each Herschel image was then split in to multiple tiles 1′×1′ in size. Fourthly, in each tile in each waveband we created a model image comprised of delta functions located at the positions of galaxies in the prior catalogue with randomly assigned flux densities, and then convolved the model with the appropriate PACS or SPIRE PSF. Fifthly, we randomly perturbed the flux densities in each model image 1000 times before identifying the model which best matches the original image (i.e., has the lowest χ2). Finally, we use this model as the starting point for the next generation of 1000 models (perturbing the flux densities using the flux density distribution from the previous generation of models) and repeat the process until convergence, that is the generation at which all model images lie within Δχ2 = 1σ of the best-fit.
We define a source as ‘detected’ if its deblended flux density is ≥3× the un-deblended flux remaining in the residual image (i.e., data-model) at its position. We assign upper-limits to the flux densities of sources that do not meet this criterion by measuring the flux density in the residual image, after the deblending process has subtracted any contribution from neighbouring bright sources.
In total, 16/31 VLBI-selected sources have measured deblended flux densities at 100 μm and 160 μm. 11/31 have upper-limits in these bands, and 4/31 lie outside the Herschel PACS survey area. A total of 4/31 sources were found in the SPIRE 250 μm image (of which 3 and 2 were detected at 350 μm and 500 μm, respectively), with 25/31 having upper-limits and 2/31 lying outside the SPIRE survey area.
2.3. X-rays
The GOODS-N field has some of the deepest Chandra X-ray coverage with full band (0.5 − 7 keV) flux limits of ∼3.5 × 10⁻¹⁷ erg cm−2 s−1 corresponding to a total exposure time of 2 Ms. Xue et al. (2016) present a catalogue of 683 X-ray sources detected. These were detected using WAVDETECT with a false positive threshold of less than 10−5, and a binomial probability source-selection criterion of less than 0.004. This catalogue represents a significant improvement over the previous X-ray catalogue in GOODS-N (Alexander et al. 2003), with an extra 186 sources detected.
We cross matched our VLBI sources to Xue et al. (2016) using a 1″ radius. In the sample of 31 VLBI-detected sources, 28 sources are located within the Chandra exposure (see Fig. 1). Of the 28 detectable sources, 64% (18/28) have X-ray counterparts. This fraction is in line with the number mentioned in Sect. 1.
In order to ensure that the X-ray luminosities are correct, we compared the redshifts used in calculating the luminosities with the VLBI-ascribed redshifts. In total, 16/18 redshifts were within < 1% of each other. For the remaining 2 sources with incorrect redshifts (J123642+621331 and J123714+621826; see Appendix A.1), the intrinsic (absorption-corrected) full-band flux, f0.5 − 7 keV, int, was recalculated. We followed the steps outlined in Sect. 3.4 of Xue et al. (2010) to obtain the full-band X-ray flux, f0.5 − 7 keV, int. The absorption-corrected 0.5 − 7 keV X-ray luminosity (L0.5 − 7 keV) was calculated using the following equation,
 (1)
(1)
where z is the source redshift, dL is its corresponding luminosity distance, and Γ is the photon index. For the remaining 10 X-ray undetected VLBI sources, we X-ray luminosity upper limits were derived by replacing f0.5 − 7 keV, int with the full band flux limit at the VLBI position. We assumed an intrinsic photon index of 1.8, which is typical of an X-ray AGN spectrum (e.g., Tozzi et al. 2006).
2.4. Radio
In this study, we use the 1 − 2 GHz VLA data reduced as part of the e-MERGE survey (Muxlow et al. 2020). We refer the reader to this paper for further details. The central rms of the observations was approximately 1.8 μJy beam−1 with a median of 3 μJy beam−1. All VLBI sources had counterparts (within a  search radius). The radio luminosities of the VLBI-detected objects range from ∼1022 to 1026 W Hz−1 with a median luminosity of 3.5 × 1024 W Hz−1 (see Fig. 6 from Radcliffe et al. 2019b).
In order to obtain spectral index measurements, we use the 5.5 GHz VLA observations of Guidetti et al. (2017). The VLA observed at 5.5 GHz in the A- and B-configuration for 14 and 2.5 h respectively. This produced a  diameter area with a central rms of ∼ 2 μJy beam−1. A total of 94 sources were extracted, above a 5σ threshold. We refer the reader to Guidetti et al. (2017) for further details.
2.5. Host morphologies
The host galaxy morphologies of the VLBI-detected objects were found using the HST F125W/F160W images from the 3D-HST survey (Skelton et al. 2014). For those sources outside this area, the ultra-deep Hawaii HDF-N (Capak et al. 2004), or the CFHT Ks-band images presented in Wang et al. (2010) are used. Due to the positional accuracy of the VLBI observations, a visual comparison between the optical images and the VLBI positions is usually sufficient for an acquisition of a host galaxy association and its morphological type. Following a similar technique to Middelberg et al. (2013), we visually group the hosts into the following morphological types: early-type and bulge dominated, late-type and spiral, irregular morphology or unclassified (i.e., have a low surface brightness or are unresolved).
We define the early type and bulge dominated group as those circular or elliptical extended objects whose surface brightness distribution drops towards the edge. The irregular category encompasses those with clumpy surface brightness distributions. The sources that are unclassified are those where a morphology cannot be attained. This is most likely due to a low signal-to-noise resulting in low surface brightness areas not detected (hence they often appear ‘point-like’).
In addition to these categories, the high-quality and high-resolution afforded from the HST data allow us to check for possible interactions and/or active mergers between the VLBI hosts and the surrounding galaxies which could be influencing AGN and star-formation activity. We define a merger here as having a tidal tail or disturbances to the host or surrounding galaxies, or a secure redshift of any nearby galaxies such that the physical distance between optical nuclei is < 75 kpc (as defined by Larson et al. 2016)2.
Optical/NIR counterparts were found to all 31 sources, but six were unresolved or unclassified. Concerning the remaining 25 sources, we find that 72% (18/25) are hosted in early type systems with 8% (2/25) hosted in late-type systems. The remaining 16% (4/25) are hosted in irregular systems. All together 28% (7/25) show evidence of interactions that are distributed as 4 irregular and 3 early type systems. It is not surprising that these VLBI sources are primarily hosted by elliptical types. The median radio power of the VLBI sample, 3.5 × 1024 W Hz−1, is far in excess of the delimiter for radio-loud AGN (L1.4 GHz > 1023 W Hz−1; Best et al. 2005), which are known to be primarily hosted by elliptical galaxies (e.g., Mannering et al. 2011). These results are consistent with those of Middelberg et al. (2013) and Herrera Ruiz et al. (2017) who also find that the majority of VLBI detections have early-type hosts.
3. Classification of VLBI-detected AGN
With these data in hand, we can now test the various AGN classification techniques used at other wavebands in the context of the VLBI-detected sample. While no single classification technique can identify the entire AGN sample (e.g., see Hickox et al. 2009; Mendez et al. 2013; Delvecchio et al. 2017), understanding the relationships between these techniques can help us identify the systematic biases of each selection technique. Furthermore, such studies are important in deriving physical parameters that depend upon cleanly separating AGN activity from star-formation.
3.1. Optical and ultraviolet
The majority of optical AGN classification methods typically require spectroscopy. The standard method is to use the line ratios [O III]λ5007/Hβ versus [N II]λ6584/Hα, also collectively known as the BPT diagram (Baldwin et al. 1981; Kauffmann et al. 2003; Kewley et al. 2013), to identify AGN. This has been extended to other line ratios with the most commonly used being [O III]/Hβ versus [S II]/Hα or [O III]/Hβ versus [O I]/Hα (e.g., Kewley et al. 2006; Juneau et al. 2011).
The present analysis would benefit greatly from optical-NIR spectroscopy, but current samples are limited to small numbers of AGN in GOODS-N. For example, Coil et al. (2015) identified 9 AGN in GOODS-N using data from the MOSDEF survey, none of which are detected in VLBI and only two have counterparts in the 1.5 GHz VLA observations (Owen 2018). The two that are detected have integrated flux densities lower than the VLBI sensitivity limit. However, these may be detected with the completion of this VLBI survey. Of the 9 AGN stated, four are identified with optical diagnostics alone.
The OPTX-survey (Trouille et al. 2008), provides optical spectroscopic observations of the 503 X-ray sources from the main X-ray catalogue of Alexander et al. (2003). This survey currently provides the largest available catalogue of optical spectroscopic information in GOODS-N. Of the 503 X-ray sources, 298 could be classified into the following categories. Sources without any strong emission lines, that is equivalent widths (EW) of [O II] < 3 Å or EW(Hα + N II) < 10 Å, are absorbers (A). Those sources with strong Balmer lines and no broad or high-ionisation lines are classed as star-formers (SF). Sources with [Ne V] or [C IV] lines, or strong {O III] (EW([O III]λ5007) > 3 EW([H II]) are high-excitation sources (HEG). Finally, those sources with optical lines having full-width half-maximum (FWHM) line-widths greater than 2000 km s−1 are broad-line AGNs (BL). In total, 17 VLBI sources have counterparts with 13 have optical classifications. Of these, only two show signs of AGN-related high excitation emission lines, with no sources showing optical broad lines. However, this sample is highly incomplete due to the X-ray selection criterion. Due to this incompleteness, and the paucity of other publicly available data, we exclude any further analysis of optical identification methods in this paper.
3.2. Infrared
Infrared classification schemes have often been used to distinguish between AGN dominated and SF dominated galaxies at high redshift. The most common schemes are the Spitzer IRAC colour–colour schemes (e.g., Stern et al. 2005; Lacy et al. 2004, 2007; Pope et al. 2008; Donley et al. 2012; Kirkpatrick et al. 2012), IRAC power-law (Alonso-Herrero et al. 2006; Donley et al. 2007), the composite Ks, IRAC and MIPS schemes (e.g., Pope et al. 2008; Messias et al. 2012, 2014), and the WISE colour–colour schemes (Mateos et al. 2012; Stern et al. 2012; Assef et al. 2013).
As briefly explained in Sect. 1, these take advantage of the dip in the SED between the 1.6 μm stellar emission and the longer wavelength emission from the 25 to 50 K cold dust heated by star-formation. However if a luminous AGN is present, this dip ceases to exist and instead a monotonic power-law SED is found in the MIR bands (e.g., Haas et al. 1998). This is a consequence of the UV radiation from the central radiation field of the AGN being reprocessed into the IR band (e.g., Pier & Krolik 1992). The extent of this flattening towards a power-law SED depends on the relative contribution to the MIR flux between the AGN and its host galaxy (e.g., see Fig. 1 from Donley et al. 2012). For the IRAC-only schemes, a total of 24 VLBI sources were considered while for the Ks+IRAC (KI) and the Ks+IRAC+MIPS (KIM) schemes, 24 and 20 sources were considered, respectively.
3.2.1. IR power law galaxies
A standard way of identifying an AGN contribution in the IR bands is the power-law selection technique (Alonso-Herrero et al. 2006; Polletta et al. 2006; Donley et al. 2007). First used by (Alonso-Herrero et al. 2006), this identifies IR power law AGN by fitting a power law to the Spitzer IRAC bands. A source is classified as an AGN if α < −0.5. Donley et al. (2007) imposed a more stringent fitting constraint of Pχ ≤ 0.1, where Pχ is the probability that a fit to a power-law distribution would yield a value greater than or equal to the observed χ2.
As explored by Donley et al. (2012) and Mendez et al. (2013), it was found that the number density of power-law selected AGN does not evolve smoothly with flux as a result of the estimated uncertainties on the flux values. As the survey sensitivity improves, the respective flux density uncertainties decrease and often the χ2 values increase. This means that, within a given flux range and a fixed survey area, a shallow survey (with larger relative uncertainties) would detect more power law AGN when compared to a deeper survey (with smaller relative uncertainties). A solution is to add a 10% uncertainty on all flux measurements (Donley et al. 2012).
We tested the power law selection for the 24 VLBI sources that have clear detections in all IRAC bands. Robust linear regression used the scipy routine ODR and the 10% uncertainty modification was applied. Seven were excluded due to a poor fit (Pχ ≥ 0.1) and of the remaining 17, only 6 (25%) were classified as AGN. This reveals that the power-law technique is only useful for those sources where the AGN truly dominates the AGN emission, and will miss those with a mixture of AGN and SF within the IRAC bands. In addition, the power-law technique seems to fail for those dust-poor (early-type) host galaxies where the torus emission is simply not present (see Sect. 3.2.2).
3.2.2. IRAC colour–colour selection
The IR colour–colour flux ratios of log10(S8 μm/S4.5 μm) against log10(S5.8 μm/S3.6 μm), where Sx μm corresponds to the IRAC flux density at x microns, has been used by many studies as an alternative to the IR power law selection technique. The Lacy et al. (2007, hereafter L07) selection criterion was empirically determined using the IRAC colours of 54 quasars selected from the Sloan Digital Sky Survey Data Release 1 (SDSS DR1; Schneider et al. 2003) along with MIR SED modelling based upon Infrared Space Observatory (ISO) spectra (Lacy et al. 2004, 2007; Sajina et al. 2005). This was reviewed by Donley et al. (2012, hereafter D12) who used XMM-Newton X-ray observations of the COSMOS deep field, along with samples of high redshift star-forming galaxies, to calibrate and refine the IRAC criterion. This resulted in a AGN selection method that is highly complete (∼75% of the XMM-Newton AGN are detected) and proven, via X-ray stacking, to be efficient at selecting obscured AGN. They note though that these selection techniques cannot effectively identify low-luminosity AGN with host-dominated SEDs.
In the left panel of Fig. 2, we show the Spitzer IRAC colour–colour diagnostics used by L07, D12 and Kirkpatrick et al. (2012, hereafter K12) in the context of our VLBI sources. The L07 wedge classifies 13/24 (54%) VLBI objects as AGN, and the K12 and D12 criteria both classify 6/25 sources (24%) of the VLBI sources.
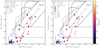 |
Fig. 2. Spitzer IRAC AGN selection criteria for the VLBI detected sample. The dashed line marks the region where a source is classified as an AGN by L07, the solid line is the revised AGN selection wedge by D12 and the dot-dashed line is the criterion used by K12. For all selection methods, AGN are those within the wedges in the top-right for all selection methods The solid line with black markers corresponds to the IR power law locus of Alonso-Herrero et al. (2006) in the range −3.0 ≤ α ≤ −0.5. Overlaid are the predicted SED colours of the ULIRG IRAS 22491, starburst galaxy M 82, AGN Mrk231, and an S0 galaxy from the SWIRE library (Polletta et al. 2007) across the same redshift range as the VLBI detections (z = 0 − 3.44). The perpendicular bars correspond to integer redshift intervals and open symbols correspond to the template MIR colours at z = 0. Left panel: VLBI-selected AGN colour coded by redshift, illustrating the large fraction of VLBI selected of AGN that are missed by the IRAC selection. Right panel: same VLBI-selected AGN sample instead plotted by host galaxy morphology. |
To investigate why these selection techniques do not detect all our VLBI sources, synthetic IRAC fluxes across the VLBI-selected sources’ redshift range (0 − 3.44) were derived using the SEDs templates of a range of nearby galaxies obtained from the SWIRE template library (Polletta et al. 2007). We track the evolution of the star-formation dominated SEDs using the starburst galaxy M 82 and the ultra-luminous IR galaxy (ULIRG), IRAS 22491. These have prominent emission between 6 and 8 μm (rest-frame) arising from polycyclic aromatic hydrocarbons (PAH) features. These features dominate the colour–colour evolution at low redshifts, but are then redshifted out of the IRAC 3.6 μm band above a redshift of one. The early-type S0 (dust-poor) galaxy SED is typically dominated by photospheric emission, and so have weak PAH emission. This explains their insignificant evolution between z = 0 and 1.5. At redshifts in excess of 2, the IRAC bands begin to sample the rest-frame 1.6 μm stellar bump, and the various SEDs start to become indistinguishable. For the AGN template, we use the Markarian 231 (Mrk231) template, which resembles a power law IR SED and spirals into the power law locus at high z.
As Fig. 2 shows, the D12 wedge avoids the evolution of the starburst/ULIRG galaxy templates until redshifts around 3.5. However, the L07 wedge suffers from significant contamination from star-forming galaxies at many redshifts and only effectively separates early-type galaxies with quiescent IR colours from those with PAH or AGN-driven IR colours. The K12 selection was designed for galaxies with redshifts in excess of 0.5 and, indeed the starburst templates are not located in this selection above this redshift. Again, this selection method can suffer from contamination at very high redshifts in excess of 3.5. On top of this, recent studies have shown that z = 2 − 3 dust-obscured star-forming galaxies can spiral in to the AGN selection wedges (e.g., Stach et al. 2019; Dudzevičiūtė et al. 2020).
In the right panel of Fig. 2, we plot the host galaxy morphologies of these VLBI detected sources, overlaid onto this colour–colour space. The majority of sources follow the redshift evolution of the various templates. Those sources in the D12 wedge have IR colours driven by excess AGN MIR emission, as shown by the Mrk231 AGN template. This plot also highlights that this selection technique preferentially selects only the most luminous MIR AGN. There are two early type galaxies, with z ∼ 1 and 0.0 < log10(S8.0 μm/S4.5 μm) < 0.2, which deviate from the expected early-type galaxy template. While this could be due to PAH features, both of these sources are obscured X-ray AGN, indicating that there may be a torus providing some excess MIR flux. Crucially these are not sufficiently luminous for the object to be classed as an AGN in the D12 or K12 wedges.
Another well used Spitzer IRAC selection technique is the Stern et al. (2005, hereafter S05) selection criterion which uses the [3.6]V − [4.5]V and [5.8]V − [8.0]V colour space. This scheme was empirically defined using the IR colours of optically selected (broad and narrow line) AGN selected from the AGES survey (Kochanek et al. 2012). It was found to be remarkably good at separating normal and active galaxies with over 90% of the broad-line AGN identified. We find it classifies a higher number of VLBI sources (8/25) compared to the D12 wedge. However, as shown in the left panel of Fig. 3, this may come at a sacrifice of completeness. The SEDs illustrate possible contamination from starburst galaxies between redshifts of 1–2 whose strong PAH emission lines produce very red [5.8]V − [8.0]V colours. In this colour space, the distinction between the early-type galaxies and IR AGN are apparent, with the well-known second vertical sequence (to the left of the AGN wedge) easily visible. This sequence is due to massive galaxies at z > 1.2 (e.g., Stern et al. 2005; Eisenhardt et al. 2008; Papovich 2008), which matches to the VLBI host morphologies as expected.
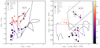 |
Fig. 3. Left panel: Spitzer IRAC AGN selection of (Stern et al. 2005). Right panel: WISE 3 band colour–colour diagram. Overplotted are the AGN selection criteria of Stern et al. (2012) (dash-dotted line), Mateos et al. (2012) (solid line) and Jarrett et al. (2011) (dotted line) |
3.2.3. WISE
Figure 3 (right panel) shows the commonly used AGN selection criteria using WISE colours. The Jarrett et al. (2011, hereafter J11) and Mateos et al. (2012, hereafter M12) selection criteria are severely limited due to the relatively poor sensitivity of the 12 μm band. As a result, only two VLBI sources can be considered, of which one is classified as an AGN. The one-colour Stern et al. (2012, hereafter S12) selection criteria is able to classify more sources due to its reliance only on the more sensitive W1 and W2 bands. However, as Fig. 3 illustrates, this selection criteria will have some contamination from high redshift starburst galaxies. This selection criteria classifies 3/13 sources as AGN (of which 2/3 are classified by the other IR AGN selection schemes). This scheme is inherently limited compared to the IRAC selection due to the differing sensitivities between the instruments. However, it does have the significant advantage of all sky coverage, thus allowing sources outside of the IRAC coverage to be evaluated.
Interestingly, J123726+621129, a Faranoff–Riley type I (FR-I) radio galaxy with large-scale radio lobes, is classified as an AGN using the S12 WISE selection criterion ([3.4]V − [4.6]V = 1.31 ± 0.18), but is not classified as an AGN in any other IR selection scheme. We inspected the WISE maps and IRAC maps of this source and found no clear evidence of blending in the W1 and W2 bands that would cause this observed colour difference. The comparable IRAC colour, [3.6]V − [4.5]V, is 0.556 for this source, which suggests that it could have exhibited some variability between the IRAC and WISE observations.
3.2.4. KI and KIM
Composite Ks + IRAC + MIPS colour schemes were proposed by Messias et al. (2012). These methods are based upon a diverse range of SED templates in order to derive highly complete AGN selection techniques. These extend the wavelength coverage to different wavebands in order to overcome the shortcomings of the IRAC-only selection schemes whilst also taking into account photometric errors when deriving the selection regions. This improves the efficiency in faint source selection.
The first method, the Ks-IRAC (KI) criterion, is designed to select AGN at z ≤ 2.5. This redshift cut was chosen as this technique suffers from contamination above this redshift, where the stellar bump in high redshift normal galaxies can mimic a IR power-law AGN at z > 2.5 (as noted in Messias et al. 2012 and shown in Figs. 2 and 4). The advantage of this scheme is the inclusion of the Ks band. This band provides a better measure of a stellar dominated waveband which can then be compared to longer wavelengths (with contributions from both AGN and stellar light). This comparison should yield a larger colour dispersion that makes it easier to separate between AGN and stellar dominated systems. It was shown to be of comparable completeness to the IRAC selection schemes (50–60%), but less prone to non-AGN contamination (> 50 − 90% successful AGN selection). For our VLBI detected sample, the KI criteria classifies 8/24 (33%).
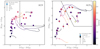 |
Fig. 4. KI and KIM selection schemes (Messias et al. 2012). Left panel: KI classification scheme suitable for IR AGN at z ≤ 2.5. Due to the redshift distribution of these VLBI sources only one is excluded from this plot. Right panel: composite 3-colour KIM selection scheme plotted in the IM colour space. Sources are classed as AGN if they satisfy the K criterion ([K]−[4.5] > 0; black circles surrounding the markers) and are located in the IM ‘wedge’. |
The second method, the Ks-IRAC MIPS (KIM) criterion is a 3-colour selection technique designed to select AGN hosts from redshifts from 0 to 7. Using an X-ray selected sample, this scheme was found to be extremely reliable (> 70 − 90%) at the cost of low completeness (∼30 − 40%). The scheme has significant advantages over IRAC only schemes. Firstly, the inclusion of [Ks]−[4.5] > 0 selection is required to reject z < 1 normal galaxies from the IRAC-MIPS colour space (as shown in Fig. 4). Secondly, the use of the longer wavelength MIPS-24 μm mitigates the sampling of the rest-frame 1.6 μm stellar bump, which causes contamination by normal galaxies at high redshifts. In the context of the VLBI sources, this selection criteria selects 8/25 (32%) VLBI detected sources as AGN. In particular, this scheme detects the two AGN that a located near the D12 wedge that may have moderate contributions from a dusty torus.
3.3. X-rays
X-rays provide one of the most powerful methods of identifying AGN and currently holds the record for the highest AGN source density (∼25 000 deg−2; Luo et al. 2017). X-ray production in AGN originates primarily from the accretion disk where the UV photons from the accretion disk are up-scattered (inverse Compton scattering) into X-ray energies (e.g., Turner & Miller 2009; Gilfanov & Merloni 2014). X-ray emission can also occur in jets, and can have been detected in low-luminosity AGN where the accretion upon the central back hole is advection-dominated (e.g., Done et al. 2007; Yuan & Narayan 2014, and references therein).
With regards to our VLBI selected sample, Chandra X-rays observations detect 64% (18/28) of the sources. It is worth noting that this is a considerably higher detection fraction compared to the Very Long Baseline Array (VLBA) observations of the COSMOS field, which detect X-ray counterparts for ∼30% of the VLBI sources (Herrera Ruiz et al. 2017). We believe this is due to the difference between the sensitivities of the X-ray observations. The COSMOS field has a limiting 0.5–10 keV flux of 8.9 × 10⁻¹⁶ erg cm−2 s−1. If we use this cut-off threshold on these GOODS-N observations, we find that 32% (9/28) have X-ray counterparts, consistent with the COSMOS-VLBA results (Herrera Ruiz et al. 2017).
Of the 18 sources detected, 14 were detected in both the soft (0.5–2 keV) X-ray band and hard (2–7 keV) X-ray bands, 2 were detected in only the soft X-ray band (J123716+621512 and J123701+622109), 1 was detected in only the hard X-ray band (J123715+620823) and the final source was only detected in the full band (J123641+621833). For those sources with no full band flux, Xue et al. (2016) estimated the absorption-corrected X-ray luminosities by extrapolating the soft and hard-band fluxes. Xue et al. (2016) provides a basic estimate of the likely source type. Here they classify a source as an AGN if it satisfies at least one of the following conditions: L0.5 − 7 keV ≥ 3 × 1042 erg s−1, as local purely star-forming galaxies have intrinsic luminosities that are lower than this value, or an X-ray hardness with Γ ≤ 1, or where log10(fX/fR) > − 1, where fX and fR are the X-ray flux (in any band) and R-band flux respectively, or where L0.5 − 7 keV ≳ 3 × (8.9 × 1017L1.4 GHz, r) where L1.4 GHz, r is the rest-frame 1.4 GHz monochromatic radio luminosity. Using these criteria, 16/18 X-ray detections are classified as AGN, with the remaining two (J123653+621444 and J123716+621512) categorised as ‘galaxies’ where the origin of X-ray emission is uncertain. X-ray observations alone can only classify 57% (16/28) VLBI-selected sources as definitive AGN.
As only 64% of our VLBI-detected AGN are even detected in X-rays, we need to understand why are all the VLBI-detected AGN not detected in X-rays, and why are some X-ray selected AGN are not detected with VLBI. We deal with the former in Sect. 4.2, while the latter is dealt with in a forthcoming paper (Radcliffe et al., in prep.).
3.4. Radio excess
The well known FIR–radio correlation is thought to originate from two related processes in the formation and death of massive stars (> 10 M⊙). The radio emission is generated via the supernovae remnants produced when these stars die, whilst the IR emission is generated by the re-processing of the UV radiation from these stars into the IR by dust. These processes are typically balanced as the starburst duration is often longer than the lifetime of these stars (e.g., Lacki et al. 2010). The relation is typically parametrised with q, which is the ratio between the rest-frame 8 − 1000 μm IR flux and the 1.4 GHz rest frame flux density. This relation is found to be invariant over four orders of magnitude and appears to hold, albeit with a mild evolution, q ∝ (1 + z)−0.19, towards a redshift of 6 (e.g., Yun et al. 2001; Ibar et al. 2008; Ivison et al. 2010; Magnelli et al. 2015; Delhaize et al. 2017). It can be used as an AGN diagnostic method as those sources with an AGN present will produce excess radio emission, moving these sources away from the correlation.
Many studies have used the MIR bands, usually the Spitzer IRAC 24 μm, as a proxy for the FIR bolometric flux (e.g., Appleton et al. 2004; Chi et al. 2013), but these often have a significant contamination from SF galaxies (see Del Moro et al. 2013). However, source blending and sensitivity restraints from longer wavelength instruments, such as Herschel, limit the number of extragalactic sources where accurate bolometric FIR fluxes can be obtained. In recent times, this has been mitigated with the development of de-blending techniques (e.g., Swinbank et al. 2014; Stanley et al. 2015; Thomson et al. 2017; Pearson et al. 2017; Liu et al. 2018), that use prior, higher resolution, catalogues to assign Herschel fluxes to individual sources, thus mitigating the natural Herschel confusion limit. We adopt and compare both approaches in this section.
3.4.1. Monochromatic radio excess – q24 and q100
We define the monochromatic radio excess parameter (qx) as,
 (2)
(2)
where Sx μm is the observed flux density at x microns and S1.4 GHz are the observed integrated VLA flux densities at 1.4 GHz. These flux densities were corrected for the difference in the central frequency (∼1.51 GHz) assuming α = −0.7, unless spectral index information is available from a 5.5 GHz counterpart (Guidetti et al. 2017). These were compiled for two different bands, the Spitzer MIPS 24 μm and the Herschel PACS 100 μm. The advantage of the monochromatic radio excess measurement is that upper limits can be derived for those sources without 3σ detections.
Figure 5 shows the q24 parameter versus redshift. The q24 evolutionary tracks (shown as the grey shaded region) are from Del Moro et al. (2013). These comprise of a range of five star-forming galaxies templates from Mullaney et al. (2011), that have been extended to shorter wavelengths using the average starburst SED from Dale et al. (2001). The radio emission is modelled by a power law with a spectral index of −0.7. Using the selection criterion of q24 < 0 (Donley et al. 2005; Del Moro et al. 2013), a large proportion of VLBI sources are classed as AGN (79%, 19/24). However, it is worth noting that this measure is prone to contamination by spectral features due to silicates and polycyclic aromatic hydrocarbons, along with contributions from AGN towards higher redshifts (e.g., Pope et al. 2006). For example, the observed 24 μm emission at z ∼ 2 corresponds to a rest emission wavelength of 8 μm, which can be influenced by power-law MIR AGN torus emission.
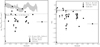 |
Fig. 5. AGN selection via the radio excess parameter. The dotted lines correspond to the AGN selection criteria of Del Moro et al. (2013) and sources below this line are classified as AGN. Upper limits are denoted by the arrows. The local radio-loud AGN, Hydra-A and the hybrid system NGC 1068 are denoted by the triangle and star markers, respectively. Left panel: q24 radio excess parameter for the VLBI selected sample. The shaded region corresponds to the q24 evolution predicted by Del Moro et al. (2013) using a range of star-forming galaxy templates. Right panel: q100 radio excess parameter for the VLBI selected sample. |
Longer wavelengths should be less susceptible to such contamination effects. We therefore used the deblended Herschel PACS 100 μm fluxes (see Sect. 2.2) to calculate q100. Only 16/27 VLBI sources had 100 μm counterparts. For the remaining sources, upper limits were derived. This measure is more successful, classifying 92.5% (25/27) of the VLBI sources as AGN using the classification criteria of q100 < 1.5 (Del Moro et al. 2013). In particular, four sources that are not classed as AGN using q24 are now classed as AGN using q100. This illustrates precisely that q24 can be influenced by AGN contamination. Indeed, three of these sources have AGN signatures using the MIR D12 criteria (with the remaining source outside of the Spitzer IRAC coverage). On Fig. 5, the radio excess values of Hydra A (a well known radio-loud AGN) and NGC 1068 (an AGN and starburst hybrid system) are plotted. These show that the radio excess method can often miss hybrid systems with both emission processes present. However, VLBI provides a clean way of separating these contributions in such systems.
3.4.2. Total infrared radio excess – qTIR
In order to calculate the total IR radio excess measure, qTIR, we rely on total infrared luminosities (LTIR), which we measure using the deblended Herschel PACS and SPIRE (100–500 μm) photometry (Sect. 2.2) following the method outlined in Swinbank et al. (2014) and Thomson et al. (2017). We begin with a composite library of AGN dominated, star-formation dominated and AGN/star-formation hybrid templates from the literature, including those of Chary & Elbaz (2001), Dale & Helou (2002), Draine & Li (2007), Rieke et al. (2009) and Arp220 (Donley et al. 2007), as well as the Eyelash submillimetre galaxy (Swinbank et al. 2010) SED. In total, this library comprises 185 distinct SED models covering a range of dust temperatures 20 K < Td < 60 K, where Td is measured from the peak of the far-IR SED using the Wien approximation (λpeakTd = 2.987 × 10⁻¹ cm K).
Next, for each EVN source in our sample we k-correct all template SEDs in the library to the rest frame using the published spectroscopic or photometric redshifts [see][for details]Radcliffe2018:p1. Finally, we fit each template SED to the 100–500 μm photometry in turn, allowing the normalisation to vary as a free parameter. We select the best-fitting template as being that which minimises χ2. For sources which are detected in three or more bands between 100 and 500 μm, we measure LIR by integrating the best-fitting template SED using the trapezium rule, and derive the associated uncertainty by measuring the range in LIR of all models which lie within 1σ of the best fit3.
We require detections in at least three of the five Herschel bands to constrain the shape of the dust SED: in total, 20/31 VLBI sources had ≥3σ flux densities from the deblended photometry in at least three Herschel bands, and total IR fluxes/luminosities were measured for these sources using the methods outlined above. An additional 4/31 VLBI sources had ≥3σ detections in two of the five deblended Herschel maps and upper-limits in the remaining three which offers insufficient discriminatory power to choose a best-fitting SED from our library of 185 templates. In order to measure template-dependent upper-limits on LIR for these sources, we first created a composite template by re-normalising the best-fitting SED templates for each of the 20/31 VLBI sources discussed in the preceding sentences to the same rest-frame 100 μm flux density and taking the mean of these templates as a function of wavelength, and then fit this composite SED template to the photometry/upper-limits of the 4/31 sources with detections in only two Herschel bands. The remaining 7/31 VLBI sources have no secure detections in any Herschel band, either because they lie outside the area of the PACS and/or SPIRE maps or because even their deblended flux densities are < 3σ upper-limits. We therefore do not attempt to fit an SED template for these sources.
The observed-frame VLA 1.5 GHz flux densities of our sample were converted to the rest-frame 1.4 GHz flux densities, S1.4 GHz, r, assuming a spectral index of α = −0.7, unless contradictory spectral index information was available from a 5.5 GHz counterpart (Guidetti et al. 2017). Following Ivison et al. (2010), the bolometric radio excess parameter (qTIR) was then calculated using,
 (3)
(3)
Figure 6 shows the qTIR parameter versus redshift for the VLBI sources selected here. The qTIR parameter for typical star-forming galaxies from Magnelli et al. (2015) and Delhaize et al. (2017), along with the 1σ and 3σ error bounds are over-plotted. All VLBI sources (100%; 18/18) are classed as radio-excess sources, exceeding the 3σ scatter on both the Delhaize et al. (2017) and Magnelli et al. (2015) relations. This metric is the most complete of all the radio excess measurements, and is less susceptible to AGN contamination that can plague the monochromatic measurements (e.g., Del Moro et al. 2013). However, constraints upon the fitting and the intrinsically weak MIR/FIR signatures of many objects means that qTIR can only be evaluated for just over half of the sources, thus dramatically reducing its effectiveness in classifying VLBI-selected AGN.
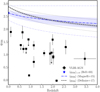 |
Fig. 6. Total radio excess parameter qTIR for the sub-set of VLBI sources with reliable estimates of the total IR luminosity available. Over-plotted are the radio-infrared correlation evolutions from Magnelli et al. (2015) and Delhaize et al. (2017). The filled regions correspond to the 1σ scatter, while the dotted lines correspond to the 3σ scatter. The integrated qTIR parameter detects all but one VLBI source and is restricted to just a small number of sources due to their weak FIR emission. |
3.5. Radio variability
Extra-galactic radio sources whose flux density varies is a characteristic sign of compact radio emission being present (e.g., Bignall et al. 2003; Koay et al. 2011). For the same reasons as a VLBI-detection, this implies high brightness temperatures (often > 1012 K), and very small emission sizes (often ∼μarcsec) which can only be attributed to AGN.
In the GOODS-N field, Radcliffe et al. (2019a) compared the flux densities of 5 epochs of 1.5 GHz VLA data over 22 years to investigate the variability of approximately 480 radio sources to a limiting detection threshold of ∼30 μJy beam−1. In this study, a total of 10 sources were found to show significant variability. However, as this study only covered a 0.17 deg2 area, and excluded those sources that are extended, only 27/31 VLBI-detected sources were included. In total, we find that 6/27 VLBI sources are classified as variables. It is worth noting that the number of VLBI sources that are variables is probably an underestimation. This is because the sparse time sampling of VLA epochs will only detect a sub-set of any flux density variations. In addition, the variability classification metric used is rather conservative, and will not detect sources with small flux density variations (< 30% difference).
Of the remaining 4 variable sources not identified by VLBI, two are below the VLBI detection threshold, while one is a 6.7σ detection in the EVN observations and may be a supernovae (Radcliffe et al. 2019a). The remaining variable source is undetected by the EVN observations presented here, but is detected by Chi et al. (2013) and has changed dramatically in VLBI measured flux densities between 2004 and 2014 (from ∼350 μJy to < 60 μJy).
3.6. Radio morphologies
A commonly used method in radio surveys is to infer the existence of an AGN based upon radio morphology alone (e.g., Banfield et al. 2015). Radio-loud AGN can have large Mpc scale jets that allow them to be easily distinguished from star-formation related emission that is often confined to within the optical extent of the host galaxy. However, in deeper ( μJy sensitivity) extra-galactic surveys, the number of these objects decrease rapidly as the radio population transitions from AGN to star-formation dominated regimes (e.g., Padovani 2016). The majority of sources are now unresolved with arcsecond resolution instruments like the VLA, that can mask AGN-related radio emission on sub-kpc scales (Muxlow et al. 2005, hereafter M05). Higher resolution instruments, such as e-MERLIN, can reveal the existence of AGN activity in these objects based upon morphology alone. In this analysis, we use the morphological analysis performed by M05 who use a combination of VLA and MERLIN to identify the origin of radio emission in the GOODS-N field. This study targets 92 radio sources with integrated flux densities in excess of 40 μJy based upon the 1.4 GHz VLA observations by Richards (2000).
The sources were categorised into AGN/AGN candidates (AGN/AGNC), starburst/starburst candidates (SB/SBc) or unclassified objects (U). In this scheme, a source is classified as an AGN if it has a compact one or two-sided axisymmetric radio morphology that is accompanied by a flat or inverted radio spectrum (as calculated between the VLA 1.4 GHz and 8.4 GHz integrated flux densities). A source is classified as a starburst if it has a steep radio spectrum and is extended on sub-galactic scales. In addition, the source must have a ISO 12 μm counterpart (Aussel et al. 1999). Sources with evidence of an additional embedded AGN component are classified as S*. Sources that do not comply with all of the characteristics are defined as AGN or starburst candidates. Finally, sources that have unclear, complex radio morphologies, which could be associated with starburst or AGN activity, are grouped into the unclassified category.
Of the 31 VLBI detected sources, 17 are included in the 92 sources considered by M05. The majority of the remaining VLBI sources were outside of the 10′×10′ region considered. For these 17 sources, 13/17 (76%) are classified as AGN (9) or AGN candidates (4), whilst only one, J123642+621331, is classified as a starburst with an embedded AGN. The remaining three sources are unclassified, with these new VLBI observations confirming the existence of an AGN. The radio morphology classification scheme seems a promising way of identifying AGN but it has been constrained to small FoVs resulting in just a few sources. The extension to M05, the e-MERLIN Galaxy Evolution Survey (e-MERGE), extends this analysis to over 800 faint radio sources and so this method can be tested more robustly in the future (Muxlow et al. 2020; Wrigley et al., in prep.).
3.7. Summary
For us to compare all AGN classification techniques, we are going define the AGN-classification metric (R) for our VLBI sample as,
![Mathematical equation: $$ \begin{aligned} R = \frac{N_\mathrm{AGN} }{N}~[\%], \end{aligned} $$](/articles/aa/full_html/2021/05/aa38591-20/aa38591-20-eq24.gif) (4)
(4)
where N are the number of VLBI-classified AGN that can be considered for the AGN classification and NAGN are the number of positive AGN classifications. In Tables 4 and 5, we present a summary of all of the AGN classification techniques discussed in the previous section. We find that the radio variability and IR power law techniques are the least effective with R ∼ 20%. This is followed closely by the other MIR selection techniques that have R between 20 and 40%. The L07 has the highest R but, as explained in D12 and Sect. 3.2.2, is most likely contaminated by significant star-formation activity. The KIM metric provides the highest IR reliability without significant contamination (R ∼ 40%). However, this method requires detections in 5 different bands in order to be evaluated which results in fewer sources being considered.
AGN classification schemes (optical, radio and radio excess selection).
AGN classification schemes (infrared and X-ray selection).
The 2 Ms Chandra X-ray AGN classification has the next best reliability with R ∼ 59%. While X-ray emission is widely assumed to be a near universal property from AGNs (Brandt & Alexander 2015) some VLBI sources remain undetected. We discuss the missing X-ray AGN in Sect. 4.2.
As expected, the radio-based AGN classification techniques are the most reliable. The M05 radio morphological classification performs well with an R ∼ 82%. However, it is worth noting that only 17 VLBI sources are contained in this study. The upcoming e-MERGE survey will extend this sample to the entire radio population of the GOODS-N field.
The most reliable metric studied is radio excess. The monochromatic radio excess measures increases in reliability towards longer wavelengths, with R ∼ 79% and R ∼ 92.5% for q24 and q100, respectively. This reflects the decreasing contamination effects of the single band IR data by AGN or redshifted PAH emission. The qTIR is the most reliable, classifying all sources as AGN. However, this is severely limited due to constraints upon the number of bands required to evaluate this metric, which limits the total number of sources to 18 in this study. To conclude, this analysis clearly shows that no single AGN classification technique identifies a VLBI-selected AGN sample.
4. The nature of the VLBI-selected population
While in the previous section we identified the reliability of each classification scheme individually, there are many biases to be addressed before we can infer about the relationships between the various classification techniques, and what they imply about the nature of the underlying AGN. The first bias is due to the varying multi-wavelength coverage and depth across the GOODS-N field (see Fig. 1), which results in each classification technique probing a different number of VLBI-sources. To mitigate this, we select a sub-sample of 24 VLBI sources that are located within the Spitzer 5.8 μm and 8.0 μm area of GOODS-N. This area is completely covered by the 1.5 GHz VLA, Spitzer IRAC and MIPS, Herschel PACS and SPIRE, and the Chandra observations. This sub-set of VLBI sources are highlighted with an asterisk in Tables 4 and 5. We note that J123721+621130 is excluded due to a nearby bright IR source  away which prevents any reliable 24 μm fluxes from be obtained.
In Fig. 7 (left panel), we illustrate the breakdown of the VLBI sample into the three main classification schemes (namely IR, radio excess and X-rays). We use the q100 metric because this can be evaluated for all 24 sources and was shown to be less susceptible to contamination from AGN. The D12 IR classification is used due to its proven reliability for selecting IR-AGN.
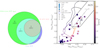 |
Fig. 7. Left panel: Venn diagram showing the breakdown of the 24 VLBI-selected AGN which can be evaluated using the D12 IR wedge, X-ray, and q100 radio excess AGN classification schemes. The combination of radio excess, IR and X-ray AGN classifies all VLBI-selected AGN but crucially no one classification technique can classify all VLBI-selected AGN. Right panel: same 24 VLBI selected AGN in the IRAC colour–colour space with the D12 wedge overlaid. All VLBI AGN in the wedge show radio-excess and X-ray signatures. |
The key point from Fig. 7 is that all VLBI sources are classified as AGN using a combination of X-ray, radio excess and IR measures. This independently verifies similar approaches used in other deep fields (e.g., Hickox et al. 2009; Mendez et al. 2013; Delvecchio et al. 2017). Indeed, Delvecchio et al. (2017) used a combination of X-ray, radio excess and SED fitting to split the VLA-COSMOS 3 GHz survey sample into AGN and star-forming galaxies, and it was found that these techniques could classify 91% of the VLBA detections correctly as AGN (Herrera Ruiz et al. 2017). In the following sub-sections, we shall explore a few different outcomes and questions arising from these analyses.
4.1. Radiatively efficient versus inefficient AGN populations
The various positive AGN classification techniques of the VLBI-selected sources in different bands can be used to infer about the nature of the VLBI-selected AGN. Observations of the local Universe have revealed that there is dichotomy in nuclear activity related to the accretion rate. AGN that are accreting efficiently (> 0.01ṀEdd) are collectively termed radiatively-efficient (RE-AGN) or ‘quasar-mode’ AGN, whilst inefficient accretion (< 0.01ṀEdd) are known as radiatively-inefficient or ‘radio-mode’ AGN (RI-AGN). For a review, see Heckman & Best (2014) and Hardcastle & Croston (2020). RE-AGN are powerful and emit across multiple wavebands (from MIR to X-rays). These objects typically exhibit high excitation emission lines and have optically thick, but geometrically thin accretion disks where the gas can radiate efficiently due to the high gas density (Shakura & Sunyaev 1973). They often exhibit MIR AGN activity due to the presence of a torus with high column densities. The accretion onto the central black hole is typically from cold gas via secular processes. Most importantly, these objects are typically radio-faint, but a small proportion emit powerful relativistic radio jets. These represent the true ‘monsters’, such as the 3C radio galaxy and quasar populations.
In contrast, RI-AGN typically do not emit across the multi-wavelength spectrum. They are typically identified by their radio emission, which manifests as jet-like radio morphologies or an excess of radio emission above that which is expected from star-formation related activity alone (Hardcastle et al. 2007). These objects are often associated with low excitation emission lines and are thought to accrete only hot gas from the galaxy halo (e.g., Hine & Longair 1979; Laing et al. 1994; Müller-Sánchez et al. 2011). The hosts of these AGN are massive and passive red sequence galaxies that are located in dense environments. AGN feedback is thought to maintain this status-quo, where episodic mechanical feedback from AGN jets transfer the energy into the surroundings, keeping halo gas temperatures high and inhibiting star-formation (e.g., Croton et al. 2006).
While we cannot get a direct measurement of the accretion rate of the central black hole, we can infer whether these VLBI sources are RE- or RI-AGN using the various AGN classifiers. We follow a similar methodology of Guidetti et al. (2017) who used IR, X-ray and radio-excess diagnostics to separate a 5.5 GHz VLA sample into RE-AGN, RI-AGN and star-formation/hybrid systems. They define RE-AGN as those radio sources identified as AGN by IR diagnostics and have a 0.5–7 keV X-ray luminosity in excess of 1042 erg s−1. In contrast, RI-AGN are identified as those radio sources having MIR colours typical of red and passive galaxies, or those showing a radio-excess (q100 < 1.5). For all other sources that do not fit into the RE-/RI-AGN classification, we classify them as undetermined instead. This is simply because we know an AGN is present but are unable to determine whether a dusty torus, typical of RE-AGN, is present.
Using these criteria we determine that 25% (6/24) of the VLBI-selected sample are classified as RE-AGN, while 42% (10/24) are classed as RI-AGN with the remaining undetermined. The preference in selecting RI-AGN is entirely expected because the surface density of radio-loud RE-AGN is much lower than of RI-AGN. However, even though we sample radio sources down to luminosities 10−8 of the most powerful 3C sources, we still obtain a reasonable number of efficiently accreting AGN.
As an aside, we stress that about half of the X-ray selected RE-AGN remain undetectable at radio wavelengths, even at the currently highest achievable sensitivity (Barger et al. 2017). Stacking techniques have in the meantime allowed us to begin to understand their nature – to be reported elsewhere.
4.2. X-ray undetected sources
There is a population of Compton-thick (CT) AGN with intrinsic column densities in excess of > 1024 cm−2 that are thought to contribute towards 10–25% of the total cosmic X-ray background (e.g., Gilli et al. 2007; Ananna et al. 2019). The general consensus is that the obscuration is caused by a dusty torus surrounding the central SMBH and its accretion disk. In these objects, the fraction of emission detected decreases at soft X-ray energies (≤10 keV). At these lower energies only the emission that is scattered rather than absorbed is detectable (Ricci et al. 2015; Koss et al. 2016). In principle, some of these sources must be detectable by these radio observations. However, it is worth stating that only some sources will have radio jets detectable by VLBI, so some CT-AGN will be missed.
Almost 36% of our VLBI sources remain undetected in the 0.5 − 7 keV Chandra observations. Of those sources with X-ray counterparts, 53% have hard X-ray spectra (an effective photon index, Γ < 1), indicative of a significant level of obscuration. The median photon index of VLBI sources is 0.87, which is lower than the median photon index of the whole X-ray sample which is 0.97.
In Fig. 7 (right panel), we show the classifications of the 24 VLBI-detected AGN within the IRAC colour–colour space. As stated earlier, there is a cluster of sources with passive IRAC colours towards the bottom left (log10(S8.0 μm/S4.5 μm) < − 0.2 ∧ log10(S5.8 μm/S3.6 μm) < − 0.1). These sources are located at lower redshifts (z ∼ 0.8) and have X-ray luminosities in the range of 1041 − 1042 erg s−1. In contrast, the X-ray undetected VLBI sources have higher average redshifts (z ∼ 1.41), but similar host morphologies. If we take those X-ray detected galaxies with passive IRAC colours, and redshift their X-ray luminosities to z = 1.41, we find that a third of these sources would now be undetected in the 2 Ms Chandra exposure. This suggests that the cause is either due to sensitivity limitations or intrinsic obscuration.
In an attempt for clarity, we used the MIR-X-ray correlation for AGN to predict the expected X-ray luminosity of the X-ray undetected VLBI sources. We used the empirical relation from Mateos et al. (2015) which relates the rest-frame 6 μm luminosity (L6 μm) to the 2–10 keV X-ray luminosity (L2 − 10 keV) by,
 (5)
(5)
where  and
and  . The 6 μm flux densities were estimated using a linear fit between the 24 μm and 8 μm flux densities and converted into a monochromatic luminosity. Using Eq. (5), expected 2 − 10 keV X-ray luminosities were calculated for each undetected source and converted to 0.5–7 keV luminosities by dividing by a factor of 0.721 (see Sect. 3.3.4 of Xue et al. 2016).
We find that all of the undetected sources should be detectable if this relation holds (with the expected X-ray luminosity between 3 and 50 times the sensitivity limit). While this could be due to obscuration, the most likely effect is due to stellar contamination which boosts the IR luminosities and the subsequent expected X-ray luminosities. Indeed, for the X-ray detected sources, we find that most (∼70%) of the expected X-ray luminosities are in excess of the measured luminosities but by a much smaller extent (approximately 5 times the measured luminosities). This suggests that the 6 μm band also has additional contributions from star-formation that causes the expected luminosities to exceed that of the measured luminosities. To disentangle the two, and to understand the reason for the missing X-ray sources, more sophisticated SED fitting routines that can decompose the AGN and star-forming contributions across the IR spectrum would be needed. However, such a study is outside of the scope of this paper.
Instead, to find the reason for the X-ray non-detections, we performed X-ray stacking with the final goal of determining the X-ray hardness ratio. A high hardness ratio would be indicative of significant obscuration implying that the Compton-thick conclusion is most viable. For this analysis, we followed the steps outlined in Vito et al. (2018) which are summarised in the following paragraphs.
Cut-outs centred on the ten X-ray non-detections were generated for each of the three Chandra X-ray bands, soft (0.5–2 keV), hard (2–7 keV) and full bands (0.5–7 keV). These cut-outs are 80 × 80 pixels in size corresponding to approximately 40″ × 40″. These were then summed and circular extraction regions that are ∼5 pixels in radius are used. These are assumed to contain all of the source counts. The background levels were derived in annuli outside of the source extraction regions. The stacks and extraction regions are shown in Fig. 8. Following Weisskopf et al. (2007), we assessed the detection significance using the binomial no-source probability, PB, which is described by,
 (6)
(6)
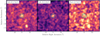 |
Fig. 8. Stacked and smoothed X-ray images of the ten X-ray non-detections in the full (0.5–7 keV; left), soft (0.5–2 keV; centre) and hard (2–7 keV; right). Each panel is approximately 40″ × 40″ in size. The blue solid circle with radius of 5 pixels ( |

where B is the total number of counts in the source region, S is the total number of counts in the source region and N = S + B is the total number of counts. p = 1/(1 + ϵ) where ϵ is the ratio of background to source region areas. The value of (1 − PB) gives the significance of the detection of a source. We follow Vito et al. (2018) and set a detection threshold of 99.95% (∼3.5σ for a Gaussian equivalent) which corresponds to a PB of 5 × 10⁻⁴.
Out of the three stacks, we confirmed a detection in the 0.5–2 keV (soft) band only, with a corresponding PB = 2.16 × 10⁻⁴. There is a tentative detection in the 0.5–7 keV (full-band) stack with a PB = 5.12 × 10⁻³ or 2.9σ in the Gaussian approximation. However, there is no statistically significant detection in the 2–7 keV or hard X-ray band (PB = 0.32 or 1.2σ).
To assess the typical X-ray spectrum of these objects, we performed a hardness ratio analysis of the stacked X-ray. Using the 0.5–2 keV and 2–7 keV stacked signals as the soft and hard source counts, respectively, the hardness ratio is calculated using,
 (7)
(7)
where 𝒮 and ℋ are the net (i.e., background-subtracted) counts in the soft and hard bands. The BEHR code (Park et al. 2006) was used to calculate this, because it accounts for the Poisson nature of both source and background counts (including non-detections). This resulted in  . This extremely soft hardness-ratio is suggestive of a distinct lack of obscuration in these sources. This indicates that the majority of the X-ray undetected sources are most likely due to the lack of sensitivity in the X-ray band rather than being Compton-thick objects.
4.3. The underlying total AGN population and the role of VLBI
In order to see where VLBI fits into the entire AGN classification scheme, we also need to reverse the analysis of the previous sections and identify the performance of VLBI in terms of the various AGN classification schemes. Due to the larger number of counterparts, we use the q24 radio excess metric, utilising the 2.2 μJy beam−1 1.5 GHz VLA catalogue of Owen (2018). This analysis is restricted to the same region outlined in the previous subsection. For the IR-AGN, we shall use the D12 metric and X-ray observations provided by the Chandra 2 Ms catalogue (Xue et al. 2016).
In particular, the ultra-deep IRAC coverage in this area (1σ3.6 μm ∼ 0.02 μJy) produces a total of 195 D12 selected MIR-AGN and there are 307 X-ray selected AGN. The radio-excess measurement, q24, reveals a total of 85 AGN.
In total, there are 507 unique AGN candidates. Around 11% of these both X-ray and IR-selected AGN and around 16.7% are radio-excess AGN. However, VLBI-selected AGN contribute to just 5% (24/507) of the total AGN content. The lack of overlap between radio excess AGN, and the X-ray and IR AGN (approximately 5% of the sample) reinforces that compact radio emission from AGN is not apparent in a large majority of AGN (e.g., Delvecchio et al. 2017; Algera et al. 2020b).
As shown in the previous section, VLBI traces mostly radio-excess AGN. However, VLBI only detects around 22% (19/85) of the q24 selected radio-excess AGN. The main reason why the number of VLBI sources do not match to the radio-excess is because the VLBI observations are inherently biased. The first bias due to the mismatch in sensitivity between the VLA observations (1σ ∼ 2 μJy beam−1) and the VLBI observations (1σ ∼ 9 μJy beam−1). As a result, the VLA observations classify a total of 85 sources as radio excess, while only 22% of these are VLBI-detected AGN. If we match the point source detection thresholds of the VLA and VLBI observations (∼ 60 μJy beam−1), the percentage of radio excess sources detected by VLBI increases to 61%. Crucially though, VLBI does not detect them all.
This brings us to the second bias namely the spatial filtering effect of VLBI. The sparse nature of VLBI arrays make them insensitive to large scale structures, for example AGN jets, which all can contribute to the excess radio emission. It has been found that at μJy flux densities the fraction of VLBI to VLA flux is around 0.6 (Herrera Ruiz et al. 2017; Radcliffe et al. 2018). For the VLBI survey presented here, which has a detection threshold of 60 μJy beam−1, we effectively sample the VLA-detected radio population with peak brightnesses in excess of 100 μJy beam−1. Even with a 100 μJy beam−1 detection threshold, these VLBI observations only detect 19/25 (76%) of the VLA radio excess sources. This is likely due to the large scatter (2.5 dex) in the VLBI to VLA flux ratio (Herrera Ruiz et al. 2017).
To alleviate these discrepancies for future surveys, and bring VLBI to be on par with radio excess measures, future observations should ensure that VLBI observations are more sensitive than the accompanying low resolution observations. However, the small bandwidths of current VLBI arrays makes this currently very time-expensive. For example, to achieve the same sensitivity as the current VLA observations of GOODS-N (1.8 μJy beam−1) would require around 15.5 days with the VLBA (assuming 2 Gbps data-rates and 10 telescopes)4. This overhead can be reduced, but with a reduction in the FoV, with the use of larger telescopes. For example, the EVN (with 2 Gbps data-rates, 10 telescopes including the 100 m Effelsberg and 76 m Lovell telescope) requires just 3.15 days, albeit the effective field of view is much smaller at  compared to the 27′ of the VLBA. Despite the large time investments required at the moment, it is worth stressing that the operational costs of a VLBI array are far less than the cost of an IR satellite needed to provide radio-excess measurements. In addition, the proposed expansion to 4 Gbps operations, the expanding number of VLBI ready telescopes, for example the East-Asian VLBI Network (An et al. 2018) and the African VLBI Network (Gaylard et al. 2011), and the inclusion of ultra-sensitive elements such as MeerKAT and the SKA, will drastically reduce the integration time needed.
Finally, it is worth stating that VLBI selects a ‘clean’ sample of radio-selected AGN, that is, it is not affected by SF-related radio emission to a far lesser effect. The selection of a radio-AGN sample through radio excess measurements is a trade-off between contamination from star-forming galaxies, or a significant bias towards those objects with large radio excesses. Delvecchio et al. (2018) estimate that their 1σ cut-off used in their radio-excess measurement means that up to a third of their sample could be contaminated by star-forming galaxies. This indicates that the combination of low and high resolution radio data is integral in order to select a clean, unbiased sample of radio-AGN. This will permit those sources with both star-formation and AGN present to be detected. This will be explored in a future e-MERGE collaboration paper.
5. Conclusions
In this paper, we continued our analysis of the VLBI-selected AGN population introduced in Paper I. Using deep, multi-wavelength data in the GOODS-N field we conducted a test of the various AGN classification techniques, from X-rays to radio, in order to determine their performance on a VLBI-selected sample of AGN. Our conclusions are as follows.
We investigated 14 different AGN classification techniques that included, (a) searching for MIR power-law AGN using the Spitzer and WISE telescopes, (b) X-ray AGN using deep 2 Ms X-ray observations provided by the Chandra telescope and (c) radio-excess AGN which uses the far-IR–radio correlation to search for radio emission above what would be expected from star-formation alone. We find that no one single AGN classification technique can reliably identify all VLBI-selected sources.
Both IR colour–colour methods and X-ray surveys are notably incomplete. In concordance with other studies, IR colour–colour methods only detect the most luminous AGN while, the latter fails due to a combination of sensitivity and Compton-thick sources. We performed stacking on the X-ray non-detections finding a soft hardness ratio suggesting that the lack of X-ray sensitivity is the main reason for the majority of the non-detections.
We find that the radio-excess parameter is the most reliable metric in identifying the majority of the VLBI-selected sample and that a combination of radio-excess, X-ray and IR can identify all VLBI-selected sources as AGN. This is verified by similar approaches used in other deep fields. Analysis of the entire VLBI-selected population revealed that around 42% of sources exist in intermediate redshift dust-poor galaxies with the majority having radiatively inefficient accretion upon their singular AGN classification through radio excess (and thus radio jets).
When extending the AGN classification methods to the total underlying AGN population, we find that VLBI and radio excess measurements are intrinsically linked and the differences between the number of AGN is related to sensitivity. With deeper VLBI observations, we would expect to detect the majority of the radio-excess selected sample. To conclude, milliarcsecond resolution VLBI remains the best method of identifying radio-AGN when ancillary IR data is unavailable.
The Herschel SPIRE maps cover the majority of the VLA and VLBI fields of view, however the PACS images cover only ∼25% of the region mapped at longer wavelengths.
We note that in Larson et al. (2016) this is a projected separation, whereas we calculated the 3D distance using the available redshift information.
For sources with spectroscopic redshifts our SED fitting procedure has two degrees of freedom, namely the choice of template SED and the flux normalisation. For sources with only photometric redshifts, we allow the template SEDs to move within the redshift uncertainties, inducing an additional degree of freedom. Following Lampton et al. (1976), we define the 1σ error bound as that which accommodates all models lying within Δχ2 = 2.3 or Δχ2 = 3.5 of the best fitting models for the cases with two and three degrees of freedom, respectively.
These values were calculated using the EVN calculator.
Note these are 95% confidence intervals.
Acknowledgments
The authors gratefully acknowledge Len Cowie and Amy Barger for allowing us to use unpublished data and would like to thank M. Mendez, R. Windhorst, J. McKean, P. Padovani and J. Hodge for their help. This research made use of Astropy, a community-developed core Python package for Astronomy (Astropy Collaboration 2013, 2018). The research leading to these results has received funding from the European Commission Seventh Framework Programme (FP/2007-2013) under grant agreement No. 283393 (RadioNet3). J. F. R. acknowledges the Science and Technologies Facilities Council (STFC), the Ubbo Emmius scholarship from the University of Groningen, and the South African Radio Astronomy Observatory (SARAO) whose funding contributed to this research. The European VLBI Network is a joint facility of independent European, African, Asian, and North American radio astronomy institutes. Scientific results from data presented in this publication are derived from the following EVN project code(s): EG078. e-MERLIN is a National Facility operated by the University of Manchester at Jodrell Bank Observatory on behalf of STFC. The National Radio Astronomy Observatory is a facility of the National Science Foundation operated under cooperative agreement by Associated Universities, Inc. This work is based on observations taken by the 3D-HST Treasury Program (GO 12177 and 12328) as well as GO 11600 and GO 13420 with the NASA/ESA Hubble Space Telescope, which is operated by the Association of Universities for Research in Astronomy, Inc., under NASA contract NAS526555. This publication makes use of data products from the Wide-field Infrared Survey Explorer, which is a joint project of the University of California, Los Angeles, and the Jet Propulsion Laboratory/California Institute of Technology, funded by the National Aeronautics and Space Administration. The authors want to thank the anonymous referee for their insightful and helpful comments that have improved this manuscript.
References
- Abazajian, K. N., Adelman-McCarthy, J. K., Agüeros, M. A., et al. 2009, ApJ, 182, 543 [Google Scholar]
- Alam, S., Albareti, F. D., Allende Prieto, C., et al. 2015, ApJS, 219, 12 [NASA ADS] [CrossRef] [Google Scholar]
- Alexander, D. M., Bauer, F. E., Brandt, W. N., et al. 2003, AJ, 126, 539 [NASA ADS] [CrossRef] [Google Scholar]
- Algera, H. S. B., Smail, I., Dudzevičiūtė, U., et al. 2020a, ApJ, 903, 138 [Google Scholar]
- Algera, H. S. B., van der Vlugt, D., Hodge, J. A., et al. 2020b, ApJ, 903, 139 [Google Scholar]
- Alonso-Herrero, A., Pérez-González, P. G., Alexander, D. M., et al. 2006, ApJ, 640, 167 [NASA ADS] [CrossRef] [Google Scholar]
- An, T., Sohn, B. W., & Imai, H. 2018, Nat. Astron., 2, 118 [Google Scholar]
- Ananna, T. T., Treister, E., Urry, C. M., et al. 2019, ApJ, 871, 240 [CrossRef] [Google Scholar]
- Appleton, P. N., Fadda, D. T., Marleau, F. R., et al. 2004, ApJ, 154, 147 [Google Scholar]
- Ashby, M. L. N., Willner, S. P., Fazio, G. G., et al. 2013, ApJ, 769, 80 [NASA ADS] [CrossRef] [Google Scholar]
- Assef, R. J., Stern, D., Kochanek, C. S., et al. 2013, ApJ, 772, 26 [Google Scholar]
- Astropy Collaboration (Robitaille, T. P., et al.) 2013, A&A, 558, A33 [NASA ADS] [CrossRef] [EDP Sciences] [Google Scholar]
- Astropy Collaboration (Price-Whelan, A. M., et al.) 2018, AJ, 156, 123 [Google Scholar]
- Aussel, H., Cesarsky, C. J., Elbaz, D., & Starck, J. L. 1999, A&A, 342, 313 [Google Scholar]
- Baldwin, J. A., Phillips, M. M., & Terlevich, R. 1981, PASP, 93, 5 [NASA ADS] [CrossRef] [EDP Sciences] [Google Scholar]
- Ballantyne, D. R., Draper, A. R., Madsen, K. K., Rigby, J. R., & Treister, E. 2011, ApJ, 736, 56 [NASA ADS] [CrossRef] [Google Scholar]
- Banfield, J. K., Wong, O. I., Willett, K. W., et al. 2015, MNRAS, 453, 2326 [Google Scholar]
- Barger, A. J., Cowie, L. L., & Wang, W.-H. 2008, ApJ, 689, 687 [NASA ADS] [CrossRef] [Google Scholar]
- Barger, A. J., Cowie, L. L., Owen, F. N., Hsu, L. Y., & Wang, W. H. 2017, ApJ, 835, 95 [Google Scholar]
- Berta, S., Magnelli, B., Nordon, R., et al. 2011, A&A, 532, A49 [NASA ADS] [CrossRef] [EDP Sciences] [Google Scholar]
- Best, P. N., Kauffmann, G., Heckman, T. M., et al. 2005, MNRAS, 362, 25 [NASA ADS] [CrossRef] [Google Scholar]
- Bignall, H. E., Jauncey, D. L., Lovell, J. E. J., et al. 2003, ApJ, 585, 653 [Google Scholar]
- Bothwell, M. S., Smail, I., Chapman, S. C., et al. 2013, MNRAS, 429, 3047 [Google Scholar]
- Brandt, W. N., & Alexander, D. M. 2015, A&ARv, 23, 1 [Google Scholar]
- Capak, P., Cowie, L. L., Hu, E. M., et al. 2004, AJ, 127, 180 [NASA ADS] [CrossRef] [Google Scholar]
- Casey, C. M., Chapman, S. C., Muxlow, T. W. B., et al. 2009, MNRAS, 395, 1249 [NASA ADS] [CrossRef] [Google Scholar]
- Chabrier, G. 2003, PASP, 115, 763 [Google Scholar]
- Chapman, S. C., Smail, I., Blain, A. W., & Ivison, R. J. 2004, ApJ, 614, 671 [NASA ADS] [CrossRef] [Google Scholar]
- Chapman, S. C., Blain, A. W., Smail, I., & Ivison, R. J. 2005, ApJ, 622, 772 [Google Scholar]
- Chary, R., & Elbaz, D. 2001, ApJ, 556, 562 [Google Scholar]
- Chi, S., Barthel, P. D., & Garrett, M. A. 2013, A&A, 550, A68 [NASA ADS] [CrossRef] [EDP Sciences] [Google Scholar]
- Coil, A. L., Aird, J., Reddy, N., et al. 2015, ApJ, 801, 35 [NASA ADS] [CrossRef] [Google Scholar]
- Condon, J. J., Condon, M. A., Gisler, G., & Puschell, J. J. 1982, ApJ, 252, 102 [NASA ADS] [CrossRef] [Google Scholar]
- Cowie, L. L., Barger, A. J., Hu, E. M., Capak, P., & Songaila, A. 2004, AJ, 127, 3137 [NASA ADS] [CrossRef] [Google Scholar]
- Cowie, L. L., Barger, A. J., Hsu, L.-Y., et al. 2017, ApJ, 837, 139 [NASA ADS] [CrossRef] [Google Scholar]
- Croton, D. J., Springel, V., White, S. D. M., et al. 2006, MNRAS, 365, 11 [NASA ADS] [CrossRef] [Google Scholar]
- Cutri, R. M., Wright, E. L., Conrow, T., et al. 2014, VizieR Online Data Catalog: II/328 [Google Scholar]
- Dale, D. A., & Helou, G. 2002, ApJ, 576, 159 [NASA ADS] [CrossRef] [Google Scholar]
- Dale, D. A., Helou, G., Contursi, A., Silbermann, N. A., & Kolhatkar, S. 2001, ApJ, 549, 215 [NASA ADS] [CrossRef] [Google Scholar]
- Delhaize, J., Smolčić, V., Delvecchio, I., et al. 2017, A&A, 602, A4 [NASA ADS] [CrossRef] [EDP Sciences] [Google Scholar]
- Del Moro, A., Alexander, D. M., Mullaney, J. R., et al. 2013, A&A, 549, A59 [NASA ADS] [CrossRef] [EDP Sciences] [Google Scholar]
- Del Moro, A., Alexander, D. M., Bauer, F. E., et al. 2016, MNRAS, 456, 2105 [NASA ADS] [CrossRef] [Google Scholar]
- Delvecchio, I., Smolčić, V., Zamorani, G., et al. 2017, A&A, 602, A3 [NASA ADS] [CrossRef] [EDP Sciences] [Google Scholar]
- Delvecchio, I., Smolčić, V., Zamorani, G., et al. 2018, MNRAS, 481, 4971 [NASA ADS] [CrossRef] [Google Scholar]
- Dickinson, M., Giavalisco, M., & GOODS Team 2003, in The Mass of Galaxies at Low and High Redshift, eds. R. Bender, & A. Renzini, 324 [CrossRef] [Google Scholar]
- Done, C., Gierliński, M., & Kubota, A. 2007, A&ARv, 15, 1 [NASA ADS] [CrossRef] [EDP Sciences] [Google Scholar]
- Donley, J. L., Rieke, G. H., Rigby, J. R., & Pérez-González, P. G. 2005, ApJ, 634, 169 [NASA ADS] [CrossRef] [Google Scholar]
- Donley, J. L., Rieke, G. H., Pérez-González, P. G., Rigby, J. R., & Alonso-Herrero, A. 2007, ApJ, 660, 167 [NASA ADS] [CrossRef] [Google Scholar]
- Donley, J. L., Koekemoer, A. M., Brusa, M., et al. 2012, ApJ, 748, 142 [Google Scholar]
- Draine, B. T., & Li, A. 2007, ApJ, 657, 810 [Google Scholar]
- Dudzevičiūtė, U., Smail, I., Swinbank, A. M., et al. 2020, MNRAS, 494, 3828 [Google Scholar]
- Eisenhardt, P. R. M., Brodwin, M., Gonzalez, A. H., et al. 2008, ApJ, 684, 905 [NASA ADS] [CrossRef] [Google Scholar]
- Elbaz, D., Dickinson, M., Hwang, H. S., et al. 2011, A&A, 533, A119 [NASA ADS] [CrossRef] [EDP Sciences] [Google Scholar]
- Farrah, D., Afonso, J., Efstathiou, A., et al. 2003, MNRAS, 343, 585 [NASA ADS] [CrossRef] [Google Scholar]
- Feltre, A., Hatziminaoglou, E., Hernán-Caballero, A., et al. 2013, MNRAS, 434, 2426 [NASA ADS] [CrossRef] [Google Scholar]
- Garrett, M. A. 2002, A&A, 384, L19 [NASA ADS] [CrossRef] [EDP Sciences] [Google Scholar]
- Garrett, M. A., Muxlow, T. W. B., Garrington, S. T., et al. 2001, A&A, 366, L5 [NASA ADS] [CrossRef] [EDP Sciences] [Google Scholar]
- Gaylard, M. J., Bietenholz, M. F., Combrinck, L., et al. 2011, in Proceedings of SAIP2011, 473 [Google Scholar]
- Giavalisco, M., Ferguson, H. C., Koekemoer, A. M., et al. 2004, ApJ, 600, L93 [NASA ADS] [CrossRef] [Google Scholar]
- Gilfanov, M., & Merloni, A. 2014, Space Sci. Rev., 183, 121 [NASA ADS] [CrossRef] [Google Scholar]
- Gilli, R., Comastri, A., & Hasinger, G. 2007, A&A, 463, 79 [NASA ADS] [CrossRef] [EDP Sciences] [Google Scholar]
- Grogin, N. A., Kocevski, D. D., Faber, S. M., et al. 2011, ApJ, 197, 35 [Google Scholar]
- Guidetti, D., Bondi, M., Prandoni, I., et al. 2017, MNRAS, 471, 210 [NASA ADS] [CrossRef] [Google Scholar]
- Haas, M., Chini, R., Meisenheimer, K., et al. 1998, ApJ, 503, L109 [NASA ADS] [CrossRef] [Google Scholar]
- Hainline, L. J., Blain, A. W., Smail, I., et al. 2011, ApJ, 740, 96 [Google Scholar]
- Hardcastle, M. J., & Croston, J. H. 2020, New Astron. Rev., 88 [Google Scholar]
- Hardcastle, M. J., Evans, D. A., & Croston, J. H. 2007, MNRAS, 376, 1849 [NASA ADS] [CrossRef] [Google Scholar]
- Hasinger, G. 2008, A&A, 490, 905 [NASA ADS] [CrossRef] [EDP Sciences] [Google Scholar]
- Heckman, T. M., & Best, P. N. 2014, ARA&A, 52, 589 [Google Scholar]
- Herrera Ruiz, N., Middelberg, E., Deller, A., et al. 2017, A&A, 607, A132 [NASA ADS] [CrossRef] [EDP Sciences] [Google Scholar]
- Hickox, R. C., Jones, C., Forman, W. R., et al. 2009, ApJ, 696, 891 [Google Scholar]
- Hine, R. G., & Longair, M. S. 1979, MNRAS, 188, 111 [NASA ADS] [Google Scholar]
- Ibar, E., Cirasuolo, M., Ivison, R., et al. 2008, MNRAS, 386, 953 [NASA ADS] [CrossRef] [Google Scholar]
- Ivison, R. J., Alexander, D. M., Biggs, A. D., et al. 2010, MNRAS, 402, 245 [NASA ADS] [CrossRef] [Google Scholar]
- Jarrett, T. H., Cohen, M., Masci, F., et al. 2011, ApJ, 735, 112 [Google Scholar]
- Juneau, S., Dickinson, M., Alexander, D. M., & Salim, S. 2011, ApJ, 736, 104 [NASA ADS] [CrossRef] [Google Scholar]
- Kauffmann, G., Heckman, T. M., Tremonti, C., et al. 2003, MNRAS, 346, 1055 [Google Scholar]
- Keenan, R. C., Trouille, L., Barger, A. J., Cowie, L. L., & Wang, W.-H. 2010, ApJ, 186, 94 [Google Scholar]
- Kewley, L. J., Heisler, C. A., Dopita, M. A., et al. 2000, ApJ, 530, 704 [NASA ADS] [CrossRef] [Google Scholar]
- Kewley, L. J., Groves, B., Kauffmann, G., & Heckman, T. 2006, MNRAS, 372, 961 [NASA ADS] [CrossRef] [Google Scholar]
- Kewley, L. J., Maier, C., Yabe, K., et al. 2013, ApJ, 774, L10 [Google Scholar]
- Kirkpatrick, A., Pope, A., Alexander, D. M., et al. 2012, ApJ, 759, 139 [NASA ADS] [CrossRef] [Google Scholar]
- Koay, J. Y., Bignall, H. E., Macquart, J.-P., et al. 2011, A&A, 534, L1 [NASA ADS] [CrossRef] [EDP Sciences] [Google Scholar]
- Kochanek, C. S., Eisenstein, D. J., Cool, R. J., et al. 2012, ApJ, 200, 8 [Google Scholar]
- Koekemoer, A. M., Faber, S. M., Ferguson, H. C., et al. 2011, ApJ, 197, 36 [Google Scholar]
- Koss, M. J., Assef, R., Baloković, M., et al. 2016, ApJ, 825, 85 [NASA ADS] [CrossRef] [Google Scholar]
- Lacki, B. C., Thompson, T. A., & Quataert, E. 2010, ApJ, 717, 1 [NASA ADS] [CrossRef] [Google Scholar]
- Lacy, M., Storrie-Lombardi, L. J., Sajina, A., et al. 2004, ApJ, 154, 166 [Google Scholar]
- Lacy, M., Petric, A. O., Sajina, A., et al. 2007, AJ, 133, 186 [Google Scholar]
- Laing, R. A., Jenkins, C. R., Wall, J. V., & Unger, S. W. 1994, in The Physics of Active Galaxies, eds. G. V. Bicknell, M. A. Dopita, & P. J. Quinn, ASP Conf. Ser., 54, 201 [Google Scholar]
- Lampton, M., Margon, B., & Bowyer, S. 1976, ApJ, 208, 177 [NASA ADS] [CrossRef] [Google Scholar]
- Larson, K. L., Sanders, D. B., Barnes, J. E., et al. 2016, ApJ, 825, 128 [NASA ADS] [CrossRef] [Google Scholar]
- Liu, D., Daddi, E., Dickinson, M., et al. 2018, ApJ, 853, 172 [Google Scholar]
- Luo, B., Brandt, W. N., Xue, Y. Q., et al. 2017, ApJS, 228, 2 [Google Scholar]
- Madau, P., & Dickinson, M. 2014, ARA&A, 52, 415 [NASA ADS] [CrossRef] [Google Scholar]
- Magnelli, B., Elbaz, D., Chary, R. R., et al. 2011, A&A, 528, A35 [NASA ADS] [CrossRef] [EDP Sciences] [Google Scholar]
- Magnelli, B., Ivison, R. J., Lutz, D., et al. 2015, A&A, 573, A45 [NASA ADS] [CrossRef] [EDP Sciences] [Google Scholar]
- Mannering, E. J. A., Worrall, D. M., & Birkinshaw, M. 2011, MNRAS, 416, 2869 [Google Scholar]
- Mateos, S., Alonso-Herrero, A., Carrera, F. J., et al. 2012, MNRAS, 426, 3271 [Google Scholar]
- Mateos, S., Carrera, F. J., Alonso-Herrero, A., et al. 2015, MNRAS, 449, 1422 [Google Scholar]
- Mateos, S., Carrera, F. J., Barcons, X., et al. 2017, ApJ, 841, L18 [NASA ADS] [CrossRef] [Google Scholar]
- Mendez, A. J., Coil, A. L., Aird, J., et al. 2013, ApJ, 770, 40 [NASA ADS] [CrossRef] [Google Scholar]
- Messias, H., Afonso, J., Salvato, M., Mobasher, B., & Hopkins, A. M. 2012, ApJ, 754, 120 [NASA ADS] [CrossRef] [Google Scholar]
- Messias, H., Afonso, J. M., Salvato, M., Mobasher, B., & Hopkins, A. M. 2014, A&A, 562, A144 [NASA ADS] [CrossRef] [EDP Sciences] [Google Scholar]
- Middelberg, E., Deller, A., Morgan, J., et al. 2011, A&A, 526, A74 [NASA ADS] [CrossRef] [EDP Sciences] [Google Scholar]
- Middelberg, E., Deller, A. T., Norris, R. P., et al. 2013, A&A, 551, A97 [NASA ADS] [CrossRef] [EDP Sciences] [Google Scholar]
- Miller, S. H., Bundy, K., Sullivan, M., Ellis, R. S., & Treu, T. 2011, ApJ, 741, 115 [NASA ADS] [CrossRef] [Google Scholar]
- Molino, A., Benítez, N., Moles, M., et al. 2014, MNRAS, 441, 2891 [NASA ADS] [CrossRef] [Google Scholar]
- Momcheva, I. G., Brammer, G. B., van Dokkum, P. G., et al. 2016, ApJS, 225, 27 [NASA ADS] [CrossRef] [Google Scholar]
- Morrison, G. E., Owen, F. N., Dickinson, M., Ivison, R. J., & Ibar, E. 2010, ApJS, 188, 178 [NASA ADS] [CrossRef] [Google Scholar]
- Mullaney, J. R., Alexander, D. M., Goulding, A. D., & Hickox, R. C. 2011, MNRAS, 414, 1082 [NASA ADS] [CrossRef] [Google Scholar]
- Mullaney, J. R., Daddi, E., Béthermin, M., et al. 2012, ApJ, 753, L30 [NASA ADS] [CrossRef] [Google Scholar]
- Müller-Sánchez, F., Prieto, M. A., Hicks, E. K. S., et al. 2011, ApJ, 739, 69 [Google Scholar]
- Murphy, E. J., Momjian, E., Condon, J. J., et al. 2017, ApJ, 839, 35 [NASA ADS] [CrossRef] [Google Scholar]
- Muxlow, T. W. B., Richards, A. M. S., Garrington, S. T., et al. 2005, MNRAS, 358, 1159 [NASA ADS] [CrossRef] [Google Scholar]
- Muxlow, T. W. B., Thomson, A. P., Radcliffe, J. F., et al. 2020, MNRAS, 495, 1188 [CrossRef] [Google Scholar]
- Novak, M., Smolčić, V., Delhaize, J., et al. 2017, A&A, 602, A5 [NASA ADS] [CrossRef] [EDP Sciences] [Google Scholar]
- Owen, F. N. 2018, ApJ, 235, 34 [Google Scholar]
- Padovani, P. 2016, A&ARv, 24, 13 [NASA ADS] [CrossRef] [Google Scholar]
- Padovani, P., Mainieri, V., Tozzi, P., et al. 2009, ApJ, 694, 235 [NASA ADS] [CrossRef] [Google Scholar]
- Pannella, M., Elbaz, D., Daddi, E., et al. 2015, ApJ, 807, 141 [NASA ADS] [CrossRef] [Google Scholar]
- Papovich, C. 2008, ApJ, 676, 206 [NASA ADS] [CrossRef] [Google Scholar]
- Park, T., Kashyap, V. L., Siemiginowska, A., et al. 2006, ApJ, 652, 610 [NASA ADS] [CrossRef] [Google Scholar]
- Pearson, W. J., Wang, L., van der Tak, F. F. S., et al. 2017, A&A, 603, A102 [NASA ADS] [CrossRef] [EDP Sciences] [Google Scholar]
- Pier, E. A., & Krolik, J. H. 1992, ApJ, 399, L23 [NASA ADS] [CrossRef] [Google Scholar]
- Planck Collaboration XIII. 2016, A&A, 594, A13 [NASA ADS] [CrossRef] [EDP Sciences] [Google Scholar]
- Podigachoski, P., Barthel, P., Haas, M., Leipski, C., & Wilkes, B. 2015, ApJ, 806, L11 [Google Scholar]
- Polletta, M. D. C., Wilkes, B. J., Siana, B., et al. 2006, ApJ, 642, 673 [NASA ADS] [CrossRef] [Google Scholar]
- Polletta, M., Tajer, M., Maraschi, L., et al. 2007, ApJ, 663, 81 [NASA ADS] [CrossRef] [Google Scholar]
- Pope, A., Scott, D., Dickinson, M., et al. 2006, MNRAS, 370, 1185 [NASA ADS] [CrossRef] [Google Scholar]
- Pope, A., Bussmann, R. S., Dey, A., et al. 2008, ApJ, 689, 127 [Google Scholar]
- Radcliffe, J. F., Garrett, M. A., Muxlow, T. W. B., et al. 2018, A&A, 619, A48 [NASA ADS] [CrossRef] [EDP Sciences] [Google Scholar]
- Radcliffe, J. F., Beswick, R. J., Thomson, A. P., et al. 2019a, MNRAS, 490, 4024 [CrossRef] [Google Scholar]
- Radcliffe, J. F., Garrett, M. A., Muxlow, T. W. B., et al. 2019b, A&A, 625, C1 [EDP Sciences] [Google Scholar]
- Rafferty, D. A., Brandt, W. N., Alexander, D. M., et al. 2011, ApJ, 742, 3 [NASA ADS] [CrossRef] [Google Scholar]
- Ricci, C., Ueda, Y., Koss, M. J., et al. 2015, ApJ, 815, L13 [NASA ADS] [CrossRef] [Google Scholar]
- Richards, E. A. 2000, ApJ, 533, 611 [NASA ADS] [CrossRef] [Google Scholar]
- Richards, E. A., Kellermann, K. I., Fomalont, E. B., Windhorst, R. A., & Partridge, R. B. 1998, AJ, 116, 1039 [NASA ADS] [CrossRef] [Google Scholar]
- Rieke, G. H., Alonso-Herrero, A., Weiner, B. J., et al. 2009, ApJ, 692, 556 [NASA ADS] [CrossRef] [Google Scholar]
- Rodighiero, G., Brusa, M., Daddi, E., et al. 2015, ApJ, 800, L10 [CrossRef] [Google Scholar]
- Rudnick, L., & Owen, F. N. 2014, ApJ, 785, 45 [NASA ADS] [CrossRef] [Google Scholar]
- Sajina, A., Lacy, M., & Scott, D. 2005, ApJ, 621, 256 [NASA ADS] [CrossRef] [Google Scholar]
- Sargent, M. T., Schinnerer, E., Murphy, E., et al. 2010, ApJ, 186, 341 [Google Scholar]
- Schneider, D. P., Fan, X., Hall, P. B., et al. 2003, AJ, 126, 2579 [NASA ADS] [CrossRef] [Google Scholar]
- Shakura, N. I., & Sunyaev, R. A. 1973, A&A, 24, 337 [NASA ADS] [Google Scholar]
- Simmons, B. D., Van Duyne, J., Urry, C. M., et al. 2011, ApJ, 734, 121 [NASA ADS] [CrossRef] [Google Scholar]
- Skelton, R. E., Whitaker, K. E., Momcheva, I. G., et al. 2014, ApJ, 214, 24 [Google Scholar]
- Smail, I., Chapman, S. C., Blain, A. W., & Ivison, R. J. 2004, ApJ, 616, 71 [NASA ADS] [CrossRef] [Google Scholar]
- Stach, S. M., Dudzevičiūtė, U., Smail, I., et al. 2019, MNRAS, 487, 4648 [NASA ADS] [CrossRef] [Google Scholar]
- Stanley, F., Harrison, C. M., Alexander, D. M., et al. 2015, MNRAS, 453, 591 [NASA ADS] [CrossRef] [Google Scholar]
- Steidel, C. C., Adelberger, K. L., Shapley, A. E., et al. 2003, ApJ, 592, 728 [NASA ADS] [CrossRef] [Google Scholar]
- Stern, D., Eisenhardt, P., Gorjian, V., et al. 2005, ApJ, 631, 163 [NASA ADS] [CrossRef] [Google Scholar]
- Stern, D., Assef, R. J., Benford, D. J., et al. 2012, ApJ, 753, 30 [NASA ADS] [CrossRef] [Google Scholar]
- Swinbank, A. M., Smail, I., Longmore, S., et al. 2010, Nature, 464, 733 [Google Scholar]
- Swinbank, A. M., Simpson, J. M., Smail, I., et al. 2014, MNRAS, 438, 1267 [Google Scholar]
- Thomson, A. P., Ivison, R. J., Simpson, J. M., et al. 2014, MNRAS, 442, 577 [NASA ADS] [CrossRef] [Google Scholar]
- Thomson, A. P., Simpson, J. M., Smail, I., et al. 2017, ApJ, 838, 119 [Google Scholar]
- Tozzi, P., Gilli, R., Mainieri, V., et al. 2006, A&A, 451, 457 [NASA ADS] [CrossRef] [EDP Sciences] [Google Scholar]
- Trouille, L., Barger, A. J., Cowie, L. L., Yang, Y., & Mushotzky, R. F. 2008, ApJS, 179, 1 [NASA ADS] [CrossRef] [Google Scholar]
- Turner, T. J., & Miller, L. 2009, A&ARv, 17, 47 [Google Scholar]
- Vito, F., Brandt, W. N., Stern, D., et al. 2018, MNRAS, 474, 4528 [NASA ADS] [CrossRef] [Google Scholar]
- Waddington, I., Windhorst, R. A., Cohen, S. H., et al. 1999, ApJ, 526, L77 [NASA ADS] [CrossRef] [Google Scholar]
- Wang, W.-H., Cowie, L. L., Barger, A. J., Keenan, R. C., & Ting, H.-C. 2010, ApJ, 187, 251 [Google Scholar]
- Weisskopf, M. C., Wu, K., Trimble, V., et al. 2007, ApJ, 657, 1026 [NASA ADS] [CrossRef] [Google Scholar]
- Whitaker, K. E., Franx, M., Leja, J., et al. 2014, ApJ, 795, 104 [NASA ADS] [CrossRef] [MathSciNet] [Google Scholar]
- Wright, E. L., Eisenhardt, P. R. M., Mainzer, A. K., et al. 2010, AJ, 140, 1868 [Google Scholar]
- Xue, Y. Q., Brandt, W. N., Luo, B., et al. 2010, ApJ, 720, 368 [Google Scholar]
- Xue, Y. Q., Luo, B., Brandt, W. N., et al. 2016, ApJ, 224, 15 [Google Scholar]
- Yang, G., Xue, Y. Q., Luo, B., et al. 2014, ApJ, 215, 27 [Google Scholar]
- Yuan, F., & Narayan, R. 2014, ARA&A, 52, 529 [NASA ADS] [CrossRef] [Google Scholar]
- Yun, M. S., Reddy, N. A., & Condon, J. J. 2001, ApJ, 554, 803 [NASA ADS] [CrossRef] [Google Scholar]
- Zinn, P.-C., Middelberg, E., & Ibar, E. 2011, A&A, 531, A14 [NASA ADS] [CrossRef] [EDP Sciences] [Google Scholar]
Appendix A: Detailed descriptions of VLBI detected objects
A.1. Previous VLBI detections
These objects were previously detected by the Chi et al. (2013) global VLBI observations. We have updated their descriptions using new data available for the GOODS-N field. As expected, we detect the majority (11/12) of the Chi et al. (2013) sources. The only source not detected, J123642+621545, is discussed in Appendix A.3.
A.1.1. J123642+621331
J123642+621331 lies in the Hubble Flanking Fields (HFF). HST ACS optical-NIR imaging (Giavalisco et al. 2004) reveal a very faint, red, disturbed galaxy. There seems to be some confusion in the literature regarding the redshift of this source and therefore an incorrect redshift is often used in subsequent analyses. Using the Keck telescope, Waddington et al. (1999) detected a strong emission line that was interpreted as a Lyα emission line, corresponding to a redshift of z = 4.424. However, the line emission originates  north-west from the radio/optical position of the galaxy. This was inferred to be caused by an in-falling gas cloud that was re-radiating Lyα emission from the AGN into our line of sight. The optical-NIR continuum emission from HST ACS imaging casts doubt on this interpretation. If the source was at z = 4.424, emission at the longest HST wavelengths would be blocked by the Lyα forest. While very red, it is clearly observed in the F606W band, and still visible in the F435W band. In addition, based upon IR and UV properties, the object would have an exceptional star formation rate of ∼6300 M⊙ yr−1 if it is at z = 4.424 (Whitaker et al. 2014). Indeed, photometric estimates suggest that its redshift is more likely to be ∼2. Hasinger (2008) derive a redshift of ∼1.77, if the original Lyα line is interpreted as a [O II]3727 line and Berta et al. (2011) assigned a photometric redshift of
  to this object. The more recent 3D-HST survey, Momcheva et al. (2016) used HST/WFC3 grism spectral measurements to derive a redshift of z = 2.012 ± 0.002 and a recent study by Murphy et al. (2017) used a MOSFIRE K-band spectrum to derive a definitive redshift of 2.018 for this object.
Spitzer IRAC (3.5, 4.5, 5.6, 8.0 μm) and MIPS (24 μm) instruments detect a faint IR source suggestive of some star formation activity. However, the spectral index across the IRAC bands is −0.89, indicative of a hot dust component from additional AGN activity (Alonso-Herrero et al. 2006). This source is also detected in the ISO 15 μm (Aussel et al. 1999), Herschel 100 μm and 160 μm PACS (Elbaz et al. 2011) and Chandra X-ray 2 Ms observations (Xue et al. 2016). Murphy et al. (2017) fitted to the SED of this object (excluding the radio flux densities) and found the stellar mass to be M* = 2.4 × 10¹⁰ M⊙, stellar mass fraction of 0.4, an IR luminosity of 2.3 × 10¹² L⊙, and a dust temperature of 70 K. The remarkably high dust temperature indicates that the bolometric luminosity is dominated by AGN activity.
Deep, combined e-MERLIN and VLA imaging (Muxlow et al. 2020) and previous MERLIN and VLA imaging (Muxlow et al. 2005; Richards 2000) indeed reveal a compact core with two-sided jet emission, further confirming the presence of an AGN. The object also exhibits a modest radio excess (q24 = −0.39 ± 0.03). This is emboldened by previous VLBI surveys. Garrett et al. (2001) EVN observations detect a compact core and Chi et al. (2013) global VLBI observations show a core (∼227 μJy) and one-sided jet emission (∼120 μJy). The Chi et al. (2013) VLBI observations derived a total integrated flux of ∼350 μJy for this object and our new EVN observations only detect an integrated flux density of 233 ± 27.9 μJy. We note that this object is near the phase centre of the Chi et al. (2013) and also these new observations, hence the primary beam correction cannot be responsible for this variability. The EVN VLBI observations show a slight hint of the counter jet as seen in the e-MERLIN observations. This is possibly due to the increased proportion of short baselines in the EVN-only observations, compared to the global VLBI array used in Chi et al. (2013). All of the evidence provided confirms that this source is a dust enshrouded nuclear starburst with AGN activity present.
A.1.2. J123644+621133
J123644+621133 is associated with a red elliptical galaxy (I = 21.6) with a spectroscopic redshift of z = 1.0128 (Barger et al. 2008). It is detected in IR Spitzer IRAC and MIPS observations, but is not detected in any Herschel bands (Elbaz et al. 2011). Based upon IR and UV fluxes, Whitaker et al. (2014) suggests that the host galaxy has a SFR of ∼4.5 M⊙ yr−1.
The VLA, JVLA, MERLIN and e-MERLIN observe large scale radio structures with jets extending to ∼162 kpc from the central AGN bearing the signs of a classical FR-I radio galaxy. As a result, there is a very large radio excess of q24 < −1.89. The MIPS 24 μm flux is only 2.5σ detection, hence, it is an upper limit. Previous EVN 1.6 GHz observations by Garrett et al. (2001) revealed a compact core component and a 5σ unresolved radio source located ∼60 mas south of the core that coincides with the axis of the jet. Global VLBI (Chi et al. 2013) and these new EVN observations only detect a barely resolved, 411 ± 44.7 μJy, compact radio core. The AGN core is a weak detection in the 2 Ms Chandra X-ray observations with an absorption-corrected luminosity of 1.1 × 1042 erg s−1 (Xue et al. 2016).
A.1.3. J123646+621405
J123646+621405 is associated with a face-on elliptical galaxy at z = 0.9610 (Barger et al. 2008). The source is detected in all Spitzer IRAC bands and 24 μm MIPS. Whitaker et al. (2014) derives a strong SFR of ∼37.2 M⊙ yr−1. It is very luminous in X-rays (1.3 × 1044 erg s−1; Xue et al. 2016), and exhibits a mild radio excess (q24 = −0.13 ± 0.04) indicating AGN activity. VLA and e-MERLIN observations detect a compact core with two-sided emission overlying the nucleus of the host galaxy. 1.6 GHz EVN observations of Garrett et al. (2001) detect a 4σ radio source at this position. Global VLBI (Chi et al. 2013) detects a compact AGN core with an extension to the north, which is in concordance with the VLA and e-MERLIN morphologies. Our new EVN observations confirm this, also detecting the slight extension to the north.
A.1.4. J123653+621444
J123653+621444 overlays the nucleus of an elliptical galaxy at z = 0.3208 (Barger et al. 2008). It is detected in the Spitzer IRAC bands and MIPS 24 μm. Based upon IR and UV properties it has a SFR of ∼0.7 M⊙ yr−1 (Whitaker et al. 2014). JVLA, e-MERLIN, VLA and MERLIN observations reveal a compact radio source with a jet extension to the east (Muxlow et al. 2005). The source shows a large radio excess (q24 = − 0.98 ± 0.13) and is seen to vary over time (Richards et al. 1998; Richards 2000; Morrison et al. 2010). Global VLBI observations detect a 80 μJy AGN core (Chi et al. 2013) and our 1.6 GHz EVN observations also detect an AGN core with an integrated flux density of ∼117 μJy. This is suggestive of an AGN being present.
A.1.5. J123608+621036
J123608+621036 is hosted by a disturbed galaxy with a spectroscopic redshift of z = 0.679 (Barger et al. 2008). The object is bright in the IR and has no radio excess (q24 = 0.98 ± 0.03) suggesting that the system is undergoing some merger-induced star formation. There is also AGN activity present. The object is detected in X-rays (Xue et al. 2016), and combined MERLIN and VLA observations observe a compact core and two sided extended emission extending across the nucleus of the galaxy (Muxlow et al. 2005). Global VLBI observations detect a slightly extended, 140 μJy, core (Chi et al. 2013). Our EVN observations also detect a slightly extended radio core with a integrated flux density of 140 μJy.
A.1.6. J123624+621643
J123624+621643 overlays a red elliptical galaxy (b = 26.52) with a spectroscopic redshift of z = 1.918 (Smail et al. 2004). e-MERLIN imaging reveals a compact component with a weak extension to the south-west that is in agreement with previous MERLIN-VLA observations (Muxlow et al. 2005, and in prep.; Richards 2000). The object shows a large radio excess (q24 = −1.08 ± 0.08) and was detected in global VLBI observations by Chi et al. (2013). 1.6 GHz EVN observations also detect the milliarcsecond radio core. Deep 2 Ms Chandra X-ray observations (Xue et al. 2016) do not detect this object, which suggests that this system could harbour an obscured AGN.
A.1.7. J123700+620910 / GN16
J123700+620910 has no optical counterpart in HST ACS imaging, but a faint, irregular host galaxy is present in HST NIR (mF125W = 23.56). This source has similar properties to J123642+621331. Deep Spitzer IRAC and MIPS, Herschel PACS and SPIRE and SCUBA 850 μm imaging (Pope et al. 2006) detect this source, which is also known as the sub-mm galaxy GN16. Based upon IR and sub-mm observations, this object was classified as a starburst galaxy with a star-formation rate of ∼ 1000 M⊙ yr−1 with a photometric redshift of 1.68. The 3D-HST survey (Skelton et al. 2014) suggests that the redshift of this object is actually at  and Whitaker et al. (2014) derives a much more modest SFR of 598 M⊙ yr−1. The object is not detected in X-rays (Xue et al. 2016), but exhibits a small radio excess (q24 = −0.1 ± 0.04) which suggests there is a dust-obscured AGN present.
Indeed, MERLIN-VLA observations detects a compact core with an extension to the north-east (Muxlow et al. 2005). Global VLBI observed a ∼150 μJy compact radio core (Chi et al. 2013) and our 1.6 GHz EVN VLBI observes a ∼163 μJy radio core with an extension to the north, that in agreement with MERLIN-VLA observations. This proves, without doubt, the presence of an AGN in this system.
A.1.8. J123715+620823
J123715+620823 is associated with a faint, extremely red object (R = 24.25 mag) with a spectroscopic redshift of z = 0.9335 (Cowie 2016 priv. comm.). The source is faint in the Spitzer IRAC bands (∼15 μJy) and the 24 μm MIPS instrument. The object is luminous and resolved (∼1.89 mJy) in recent VLA observations (Morrison et al. 2010), and has a relatively large radio excess value (q24 = −0.99 ± 0.06). In the MERLIN  resolution imaging, the compact radio core is revealed and is unresolved. However, global VLBI observations resolves the core that shows extended emission to the north-east (Chi et al. 2013). This source has experienced a considerable change in flux density between the 2004 global VLBI observations (∼0.65 mJy) and these 2014 EVN observations (∼2.8 mJy). However, this source is
  from the Chi et al. (2013) pointing centre so primary beam attenuation could contribute to this variability.
A.1.9. J123717+621733
J123717+621733 is associated with a I = 22.2 optical counterpart with a spectroscopic redshift of z = 1.146 (Barger et al. 2008). HST NIR imaging shows an edge on spiral galaxy with a bright nuclear region. The object exhibits a high SFR of ∼ 316 M⊙ yr−1 (Whitaker et al. 2014). It has no 24 μm radio excess (q24 = 0.52 ± 0.03) but has a slight radio excess in the 100 μm radio excess measurement (q100 = 1.01 ± 0.05). MERLIN-VLA observations detect a compact radio component with a  one-sided extension to the south-west (Muxlow et al. 2005). New e-MERLIN observations suggest that there is an extension to the north-east (Muxlow et al. 2020) with the emission extended across the face of the host galaxy, thus confirming that the origin of the radio emission is partially due to star-formation. Global VLBI observations detects a 177 μJy compact radio component (Chi et al. 2013), and our 1.6 GHz EVN observations detect a compact radio source with integrated flux density of 269 ± 32.7 μJy. This confirms the presence of an AGN in this system. Chandra X-ray imaging categorise this as an AGN with a absorption-corrected flux of 1.5 × 1042 erg s−1 (Xue et al. 2016).
A.1.10. J123716+621512
J123716+621512 is associated with a I = 19.8 elliptical galaxy at z = 0.5605 (Barger et al. 2008). HST NIR imaging reveals that this system is undergoing a merger with a companion galaxy with a spectroscopic redshift of 0.559 (Skelton et al. 2014). This corresponds to a merger separation of 13.7 kpc. It is detected in all Spitzer IRAC bands and the 24 μm MIPS band. Whitaker et al. (2014) derive a SFR of ∼3.6 M⊙ yr−1. The source is very faint in wide-band X-ray observations (3.7 × 1041 erg s−1) and is not classified as an AGN based upon X-ray characteristics. The object has a mild radio excess, q24 = −0.02 ± 0.05. MERLIN-VLA imaging shows a one-sided emission that extends  to the south-east (Muxlow et al. 2005). Global VLBI observations detect a ∼100 μJy compact radio core and our new 1.6 GHz EVN observations detects a compact radio core with an integrated flux density of ∼125 μJy. This core has a slight extension to the north-east. This confirms the presence of a merger-induced AGN within this system.
A.1.11. J123721+621130
J123721+621130 is hosted by an extremely red (K = 21.06 mag) galaxy with a photometric redshift of 2.02 (Skelton et al. 2014). Spitzer IRAC and MIPS 24 μm along with Herschel PACS and SPIRE bands detect a IR bright foreground galaxy approximately  to the NE. Due to the large IR resolutions, this makes any accurate IR measurement difficult for this source. The source is detected in X-rays by Chandra (Xue et al. 2016).
MERLIN-VLA imaging reveals a compact core with one sided emission to the north (Muxlow et al. 2005). Global VLBI observations (Chi et al. 2013) detects a core and extension to the north that is in agreement with Muxlow et al. (2005). Our EVN observations only detect the core but the integrated flux density (364 ± 41.6 μJy) is significantly higher than the Chi et al. (2013) observations who report a integrated flux density of 254 ± 51 μJy. However, this source is located ∼5′ from the pointing centre, therefore, the lack of primary beam correction in the Chi et al. (2013) observations could cause this discrepancy.
A.2. New VLBI detections
A.2.1. J123555+620902
J123555+620902 is associated with a red elliptical galaxy at a redshift of 1.8750 (Barger et al. 2008) with a stellar mass of 1011.1 M⊙ (Hainline et al. 2011). The source is a known sub-mm galaxy, and is detected in the SCUBA 850 μm survey, which estimates a dust temperature of ∼47 K for this object (Chapman et al. 2005). The source has a molecular gas mass of 1010.64±0.13 M⊙ (Bothwell et al. 2013). The source shows signs of an AGN in the MIR (including WISE criteria), radio-excess, and is a bright X-ray AGN with an absorption corrected luminosity of 3.1 × 1044 erg s−1. 1.5 GHz VLA observations show a barely resolved source with an integrated flux density of 192 μJy overlaying the optical maximum. These new VLBI observations confirm the AGN nature of this host with a primary beam corrected flux density of 100 μJy. Due to the AGN signatures in all bands, this source is most likely a jetted RE-AGN whose AGN output dominates the bolometric luminosity of the object.
A.2.2. J123607+620951
J123607+620951 is hosted by a large edge-on spiral galaxy with a spectroscopic redshift of 0.6380 (Barger et al. 2008) and a stellar mass of 1011.06 M⊙ (Miller et al. 2011). A possible companion galaxy around  from the VLBI host could be the cause of the enhanced AGN activity. However, redshift estimates for this galaxy, which are photometric only, are very uncertain. Skelton et al. (2014) and Yang et al. (2014) estimate a redshift of 0.6065 and
  , respectively.
This source shows evidence of AGN activity only in X-rays, and only has a very mild radio excess (qTIR = 1.86 ± 0.09; see Fig. 6). Simmons et al. (2011) estimates that the central black hole has a mass of 108.71±0.5 M⊙ and is accreting at ∼1.3% of Eddington luminosity. The source is only slightly resolved in the 1.5 GHz VLA observations with an integrated flux density of 205 μJy. e-MERLIN observations show that the source is compact and point-like. These VLBI observations reveal an unresolved radio core with an integrated flux density of 118 ± 21.2 μJy. This detection confirms the underlying AGN nature of this source.
A.2.3. J123618+621541/HDF130
J123618+621541 is optically associated with a faint (I = 24.27) elliptical galaxy at z = 1.993 (Smail et al. 2004). It is detected in Spitzer IRAC and MIPS data, but is not detected in X-ray observations. It has a large radio excess value indicative of AGN activity (q24 = −0.96 ± 0.09). This object is not detected in X-rays (Xue et al. 2016). This object was originally categorised as a sub-mm faint star-forming radio galaxy because the UV spectra from the Keck/Low Resolution Imaging Spectrometer (LRIS) resembles that of a starburst galaxy (Chapman et al. 2004). However, using high resolution MERLIN observations, Casey et al. (2009) revealed that this galaxy is most probably a highly evolved giant elliptical galaxy, with a beamed low-luminosity AGN. The stellar mass and black hole mass is estimated to be ∼ 2.5 × 10¹¹ M⊙ and ∼ 3.2 × 10⁸ M⊙, respectively. These evolved objects are rare at z ∼ 2, with the physical size of the host galaxy approximately 2–5 times larger than typical galaxies at the same redshift (Casey et al. 2009). Our 1.6 GHz EVN observations confirm the existence of an AGN with a detection of an AGN core with an integrated flux density of 192 μJy. This was not detected by Chi et al. (2013), although being theoretically detectable (only 2′ from Chi et al. (2013) pointing centre), thus suggesting that this source could exhibit some radio variability on milliarcsecond scales.
A.2.4. J123620+620844
J123620+620844 is hosted by an elliptical galaxy (I = 21.05) with a spectroscopic redshift of 1.0164 (Barger et al. 2008). It is detected in the Spitzer IRAC and MIPS bands. Whitaker et al. (2014) derive a SFR of ∼ 3.5 M⊙ yr−1. The object exhibits a large radio excess indicating there is an active AGN (q24 = −0.88 ± 0.20). High resolution, MERLIN-VLA imaging reveals a 115 μJy compact radio component with a small  extension to the west. Our new EVN observations detect a ∼185 μJy radio core with a slight extension to the west, in agreement with the VLA-MERLIN observations. This source is identified as variable in Radcliffe et al. (2019a), further confirming the AGN nature, and the flux density differences between the EVN and VLA-MERLIN measurements.
A.2.5. J123621+621708
Inspection of the HST F125W NIR images reveals two possible interacting galaxies that are  apart. The VLBI source has a spectroscopic redshift of 1.988 (Chapman et al. 2005) whilst the possible companion has been prescribed the same redshift by Barger et al. (2008). It is possible that these spectroscopic redshifts could be tied to the wrong galaxy because the Chapman et al. (2005) survey uses the VLA radio positions as priors, where the radio emission is combined into one source. Photometric estimates put the VLBI host at z ∼ 2.3 and companion at a different redshift of z ∼ 2.13 (Skelton et al. 2014). However, the disturbed morphology does lend itself to an ongoing merger scenario.
The VLBI-detection is weak (∼135 μJy) and both galaxies are detected in the 1.5 GHz VLA observations. The VLBI-host and interacting galaxy have integrated flux densities of 143.4 ± 14.7 μJy and 52.0 ± 7.5 μJy, respectively. The VLBI host exhibits a large radio excess (q24 = −0.86 ± 0.15), while the companion exhibits no radio excess (q24 = 0.83 ± 0.21). This indicates that the radio emission in the companion may be caused by merger-induced star-formation. Using the relation from Novak et al. (2017), and assuming a spectral index of −0.7, we derive a SFR for the companion galaxy of ∼270 M⊙ yr−1.
A.2.6. J123622+620654
J123622+620654 is associated with a faint red host galaxy (K = 22.59 mag) with a photometric redshift of  (Skelton et al. 2014). It is detected in Spitzer IRAC and MIPS instruments and the 160 μm Herschel. Whitaker et al. (2014) derive a SFR of ∼55 M⊙ yr−1, indicating significant star-formation activity. The object exhibits a small radio excess (q24 = −0.44 ± 0.05) and is not detected in X-rays (Xue et al. 2016).
The object is present in re-processed MERLIN-VLA data, which reveals a compact radio core and a small two-sided extension in an east-west direction. Note that this was not reported in Muxlow et al. (2005) because the object is outside the survey range. Our EVN observations confirm the presence of an AGN, revealing a faint, compact radio core.
A.2.7. J123641+621833
J123641+621833 is hosted by a spiral galaxy with a spectroscopic redshift of 1.1456 (Barger et al. 2008). It is detected in the Spitzer IRAC and MIPS instruments. It is also detected in the Herschel 100 μm and 160 μm bands. Whitaker et al. (2014) derives a SFR of ∼24.5 M⊙ yr−1. The object has a large radio excess value (q24 = −0.98 ± 0.09) and a Chandra X-ray detection (Xue et al. 2016), which suggests significant AGN activity.
This object was out of the Muxlow et al. (2005) survey scope, but re-processed MERLIN-VLA data reveals an unresolved radio core. Our new EVN observations just resolve the object into a radio core and a small (∼7 mas) extension to the west.
A.2.8. J123650+620738
J123650+620738 is associated with a disturbed irregular galaxy with a spectroscopic redshift of 1.6095. The object has a double nucleus that could be due to a dust band or an ongoing merger in the system. The VLBI detection is located in the south nucleus with a primary beam corrected flux density of 98.7 ± 19.9 μJy. High resolution e-MERLIN observations (Muxlow et al., in prep.) shows the radio emission is extended across both optical nuclei. This could be either due to jets originating from the AGN, starburst activity or a second AGN system. Closer inspection of the VLBI images reveal a possible 5.5σ peak located in the optical maximum of the north nucleus indicating that it could be another AGN. However, combined EVN e-MERLIN observations presented in future work should confirm this hypothesis.
This object shows signs of AGN activity in all wavebands. The source is classed as a high-excitation emission line galaxy (Trouille et al. 2008), and shows evidence of power-law MIR AGN activity (Donley et al. 2007). All other IR classification methods deem this an AGN and the object is extremely bright in the X-rays (L0.5 − 7 keV = 5 × 1044 erg s−1). Detailed SED fitting by Del Moro et al. (2016) show that 94% of the rest-frame 6 μm emission is due to the AGN. Hence, the observed 24 μm, corresponding to rest-frame 9.2 μm emission, is highly contaminated by AGN contributions. This is reflected in the q24 parameter which shows no radio excess, but the longer wavelength estimates (q100 and qTIR) indicating the presence of an AGN.
A.2.9. J123659+621833
This object is associated with a faint, red host galaxy (K = 22.19), with a photometric redshift of  (Skelton et al. 2014). It is a faint detection in Spitzer IRAC and MIPS and has a strong negative spectral index across the IRAC bands (αIR ∼ −1.1). This suggests that the MIR is dominated by AGN activity. The host galaxy is not detected in HST ACS observations (Giavalisco et al. 2004). Whitaker et al. (2014) derives a large SFR of ∼294 M⊙ yr−1 for this object. It is also detected in Chandra X-rays (Xue et al. 2016) and has a large radio excess (q24 = −1.18 ± 0.04).
Re-processed MERLIN-VLA observations detects a bright compact object with a 1″ extension to the south. More recent VLA observations detects a 4 mJy compact object and there is indications that the object could be variable. Our EVN VLBI observations prove unequivocally that an AGN is present. We reveal a 2.6 mJy radio core which is extended in a north-west and south-east direction.
A.2.10. J123709+620838
J123709+620838 is hosted by a I = 21.06 galaxy with a spectroscopic redshift of 0.907 (Cowie et al. 2004). The object is detected in the Spitzer IRAC and MIPS instruments with a derived SFR of ∼ 11.4 M⊙ yr−1. The object has a mild radio excess (q24 = −0.63 ± 0.14) and is detected in X-rays (Xue et al. 2016). The Herschel SPIRE and PACS instruments also detect a source at this position, but it is uncertain whether the flux originates from the VLBI host galaxy. This is because the angular resolution is comparable to the separation of this source and a separate Spitzer, radio and optical detection  away (J123709+620841).
VLA observations suggests that this object is variable (Richards et al. 1998; Morrison et al. 2010). Combined MERLIN-VLA data detect a compact radio core and faint extension to the west, indicative of AGN activity (Muxlow et al. 2005). Our 1.6 GHz EVN observations reveal a compact object that has an extension to the west that is in agreement with MERLIN-VLA observations.
A.2.11. J123714+621826
J123714+621826 is associated with a very faint, red galaxy (K = 24.41 mag) with a tentative photometric redshift of 3.44 (Cowie et al. 2017). The object is faint in Spitzer IRAC and MIPS and is also detected by Herschel PACS and SPIRE instruments. It has a large radio excess (q24 = −1.04 ± 0.06) and is detected by the Chandra X-ray telescope (Xue et al. 2016) indicative of an AGN.
The object was not recorded in Muxlow et al. (2005), but re-processed MERLIN-VLA data reveal a compact, 0.5 mJy radio core (not primary beam corrected). Morrison et al. (2010) VLA and JVLA observations detect radio emission at a similar flux density (∼0.6 mJy) indicating that the majority of this radio emission occurs on sub-arcsecond scales. Our VLBI observations detect a ∼629 μJy AGN core indicating that the radio emission of this object is AGN dominated.
A.2.12. J123720+620741
J123720+620741 is associated with a I = 20.4 galaxy with a photometric redshift of  (Yang et al. 2014). Radio observations indicate that this object is variable, confirming the presence of an AGN. Richards et al. (1998) VLA observations in 1994 detected a 217 μJy radio source, while the 2006 VLA observation by Morrison et al. (2010) observed a 50% decrease in flux density (117 μJy). JVLA observations in 2011 saw only a small difference (127.4 μJy). Our new EVN observations detect a ∼112 μJy radio core and extension to the south, which suggests that the source may have increased in flux since 2011.
A.2.13. J123726+621129
J123726+621129 is optically associated with a faint (I = 23.57 mag) galaxy with a spectroscopic redshift of 1.2653 (Barger et al. 2008), however Cowie priv. comm. suggests a spectroscopic redshift of 0.943 for this object. HST imaging reveals that the host galaxy morphology looks disturbed and may have undergone a recent merger (Giavalisco et al. 2004). The object is detected by all Spitzer bands (Dickinson et al. 2003; Ashby et al. 2013), but is not detected by the Chandra X-ray observatory (Xue et al. 2016). Whitaker et al. (2014) derive a SFR of ∼17 M⊙ yr−1, but this was assuming the photometric redshift of 1.67 from the 3D-HST survey (Skelton et al. 2014).
The VLA, JVLA, MERLIN and e-MERLIN observes a faint radio core and two-sided radio emission with a typical wide-angled tail (WAT) morphology. The radio lobes extend by  from the core in an east-west orientation. As a result, the object has a very high radio excess value q24 = −2.29 ± 0.15. Our 1.6 GHz EVN observations resolve out the vast radio lobes and hotspots, isolating the faint radio core, which is unresolved at a resolution of 16 mas.
A.2.14. J123649+620439
J123649+620439 overlays the core of a bright elliptical galaxy (I = 17.1) with a spectroscopic redshift of 0.1130 (Abazajian et al. 2009; Barger et al. 2008). Chandra observations detect a faint X-ray source with an absorption corrected luminosity of 6.1 × 1040 erg s−1 (Xue et al. 2016). VLA observations detect a 686 ± 69 μJy object that is resolved, but has no morphological indication of AGN jet activity. The object shows no radio excess emission (q24 = 0.35 ± 0.06), suggesting that some radio emission originates from star-formation related processes. Our EVN observations detect an AGN core, which is slightly resolved to the south-west. The AGN core has an integrated flux density of 102 μJy. However, this source has not been primary beam corrected, because it lies outside the FWHM of the 100 m Effelsberg telescope.
A.2.15. J123701+622109
J123701+622109 overlies the nucleus of a I = 20.92 mag galaxy with a spectroscopic redshift of 0.8001 (Barger et al. 2008). The source is detected by Spitzer IRAC and MIPS instruments and Whitaker et al. (2014) derives a SFR of ∼6.1 M⊙ yr−1. Morrison et al. (2010) VLA observations detect a 0.33 mJy source at this position and re-processed VLA-MERLIN observations reveal an unresolved radio core, centred on the larger galaxy. The existence of an AGN is confirmed by our EVN observations that reveal a faint radio core. The object has a large radio excess value of q24 = −1.31 ± 0.19. The AGN activity in this galaxy could have been induced by the interaction with the candidate companion galaxy.
A.2.16. J123739+620505
J123739+620505 coincides with a very weak optical detection (I = 27.45) and is not detected in Spitzer IRAC instruments (Yang et al. 2014). The object was assigned a very tentative redshift of  . This object is out of the sky coverage of the majority of the GOODS-N multi-wavelength surveys, hence there are few multi-wavelength counterparts. VLA observations detect a barely resolved, 235 μJy radio detection. These VLBI observations detects a 194 μJy radio core, thus confirming the presence of an AGN in this system. We note that this source is not primary beam corrected.
A.2.17. J123751+621919
J123751+621919 is hosted by an elliptical galaxy (Ks = 20.294) with a secure photometric redshift of  (Yang et al. 2014). This photometric redshift is in agreement with the ALAHAMBRA survey estimate of
  (Molino et al. 2014)5. The source is at the edge of the HST NIR (F125W and F160W) coverage, but is outside the field of view of the optical HST bands. The source has Herschel counterparts, and the total radio excess measurement indicate the presence of an AGN (qTIR = 0.93 ± 0.17). X-ray and IR AGN measures show no sign of an AGN in this object. VLA radio observations reveal a partially resolved source with an integrated flux density of 155 μJy. Radcliffe et al. (2019a) reveals that the radio emission shows signs of variability, further strengthening the AGN nature of this object. VLBI observations show a resolved 181 μJy core which has not been primary beam corrected. This indicates that the VLBI core flux density may be in excess of the VLA data presented in Paper I. This further reinforces the variable nature of this object, and the presence of an AGN in this system.
A.2.18. J123523+622248
J123523+622248 is hosted by a faint elliptical galaxy (R = 24.0) with a tentative photometric redshift of  (Wang et al. 2010; Yang et al. 2014). The source is located outside the deep multi-wavelength coverage in GOODS-N, hence it has no HST or X-ray counterparts. The host has faint WISE counterparts in bands W1 and W2 (3.4 μm and 4.5 μm respectively; Cutri et al. 2014). However, the Stern et al. (2012) AGN classification criterion does not classify this source as an AGN. These VLBI observations reveal the existence of an AGN, which is partially resolved, and exhibits a sub-jet to the south-west. Note that the source has no primary beam correction applied so no accurate flux density for this object can be obtained. VLA observations show a 1.7 mJy slightly resolved source which is extended in the same direction as the VLBI observations.
A.2.19. J123510+622202
J123510+622202 coincides with a faint, red galaxy (V ≈ 26) with an unknown morphological type (Capak et al. 2004; Wang et al. 2010). Again, the source is located outside the deep multi-wavelength coverage therefore has no HST or X-ray coverage. As a result, the photometric redshift is fairly uncertain. We have adopted the Yang et al. (2014) value of  which is in agreement with the Rafferty et al. (2011) photometric redshift of
  . VLA 1.5 GHz observations reveal an almost unresolved 1.2 mJy source. These VLBI observations reveal a compact unresolved core indicative of AGN activity. Again, the source has no primary beam correction applied so an accurate flux density cannot be obtained.
A.2.20. J123656+615659 – SDSS J123655.80+615659.3
J123656+615659 is hosted by a compact elliptical galaxy (g = 21.7 mag) with a spectroscopic redshift of 0.41938 (Alam et al. 2015). Unfortunately, this was overlooked at the time of publication of Paper I who quoted the photometric redshift of  from Yang et al. (2014). This discrepancy makes little difference in the analysis presented here. The radio morphology of this object is a classic FR-I system (P1.4 GHz ≈ 1025.1) with radio lobes extending to a projected linear size of approximately 100 kpc. The total flux density is approximately 24 mJy of which 7.2% is polarised (mainly the core and northern jet; Rudnick & Owen 2014). The VLBI source is located well beyond the 25 m parabolic antenna FWHM, hence no primary beam correction has been attempted, but we note that the VLBI core flux density is in excess of 524 μJy.
A.3. Non-detection: J123642+621545
Our observations did not detect this object, but Chi et al. (2013) detected a 343 ± 101 μJy radio core with a north-south extension. This indicates that there is a highly variable AGN present and is confirmed by the recent variability study presented in Radcliffe et al. (2019a). The Chi et al. (2013) VLBI detection overlies the nucleus of a large spiral galaxy (see Fig. A.2) at z = 0.857 (Cowie et al. 2004). X-ray observations classifies this object as an AGN, with an absorption corrected 0.5 − 7 keV luminosity of 9.9 × 1042 erg s−1 (Xue et al. 2016). 1.4 GHz 1996 VLA observations detect a flux density of 131 μJy and 2011 JVLA observations, at 1.5 GHz, detected a similar flux of ∼150 μJy. This is approximately 200 μJy less than the milliarcsecond scale core detected with global VLBI. The stable quiescent component emission overlays the nuclear region of the galaxy and falls on the radio–IR correlation (q24 ∼ 0.75 and q100 ≈ 1.9). This may indicative of nuclear star-formation, possibly induced by the AGN activity or vice-versa. UV and IR data estimate a SFR of ∼85.7 M⊙ yr−1 (Whitaker et al. 2014). From the low flux density state VLA emission, the radio SFR of this object is calculated to be ∼170 M⊙ yr−1 using Eq. (13) from Novak et al. (2017) and assuming a Chabrier IMF (Chabrier 2003).
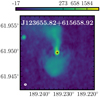 |
Fig. A.1. 1.5 GHz VLA observations of J123656+615659 showing a classical FR-I morphology. The units are in μJy beam−1 |
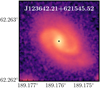 |
Fig. A.2. HST F160W imaging of the host galaxy of J123642+621545, a variable VLBI-selected source. This was detected in the 2004 Global VLBI observations (Chi et al. 2013), but not in the 2014 observation presented in this paper. The quiescent radio emission is consistent with star-formation, that could indicate a nuclear starburst being present or low-luminosity AGN jet emission. |
All Tables
Number of multi-wavelength VLBI counterparts and sensitivities of each waveband.
All Figures
|
Fig. 1. Sub-set of observations in the GOODS-N field illustrating the multi-wavelength coverage. VLBI detections from Paper I are plotted as black circles, and the field-of-view (FoV) of the multiple surveys are colour-coded. The non-uniform coverage across multiple instruments is clearly shown. The FoVs were calculated using an edge detection algorithm on the exposure maps apart from radio observations, which corresponds to the HPBW of a 25 m telescope at 1.5 GHz ( |
| In the text | |
|
Fig. 2. Spitzer IRAC AGN selection criteria for the VLBI detected sample. The dashed line marks the region where a source is classified as an AGN by L07, the solid line is the revised AGN selection wedge by D12 and the dot-dashed line is the criterion used by K12. For all selection methods, AGN are those within the wedges in the top-right for all selection methods The solid line with black markers corresponds to the IR power law locus of Alonso-Herrero et al. (2006) in the range −3.0 ≤ α ≤ −0.5. Overlaid are the predicted SED colours of the ULIRG IRAS 22491, starburst galaxy M 82, AGN Mrk231, and an S0 galaxy from the SWIRE library (Polletta et al. 2007) across the same redshift range as the VLBI detections (z = 0 − 3.44). The perpendicular bars correspond to integer redshift intervals and open symbols correspond to the template MIR colours at z = 0. Left panel: VLBI-selected AGN colour coded by redshift, illustrating the large fraction of VLBI selected of AGN that are missed by the IRAC selection. Right panel: same VLBI-selected AGN sample instead plotted by host galaxy morphology. |
| In the text | |
|
Fig. 3. Left panel: Spitzer IRAC AGN selection of (Stern et al. 2005). Right panel: WISE 3 band colour–colour diagram. Overplotted are the AGN selection criteria of Stern et al. (2012) (dash-dotted line), Mateos et al. (2012) (solid line) and Jarrett et al. (2011) (dotted line) |
| In the text | |
|
Fig. 4. KI and KIM selection schemes (Messias et al. 2012). Left panel: KI classification scheme suitable for IR AGN at z ≤ 2.5. Due to the redshift distribution of these VLBI sources only one is excluded from this plot. Right panel: composite 3-colour KIM selection scheme plotted in the IM colour space. Sources are classed as AGN if they satisfy the K criterion ([K]−[4.5] > 0; black circles surrounding the markers) and are located in the IM ‘wedge’. |
| In the text | |
|
Fig. 5. AGN selection via the radio excess parameter. The dotted lines correspond to the AGN selection criteria of Del Moro et al. (2013) and sources below this line are classified as AGN. Upper limits are denoted by the arrows. The local radio-loud AGN, Hydra-A and the hybrid system NGC 1068 are denoted by the triangle and star markers, respectively. Left panel: q24 radio excess parameter for the VLBI selected sample. The shaded region corresponds to the q24 evolution predicted by Del Moro et al. (2013) using a range of star-forming galaxy templates. Right panel: q100 radio excess parameter for the VLBI selected sample. |
| In the text | |
|
Fig. 6. Total radio excess parameter qTIR for the sub-set of VLBI sources with reliable estimates of the total IR luminosity available. Over-plotted are the radio-infrared correlation evolutions from Magnelli et al. (2015) and Delhaize et al. (2017). The filled regions correspond to the 1σ scatter, while the dotted lines correspond to the 3σ scatter. The integrated qTIR parameter detects all but one VLBI source and is restricted to just a small number of sources due to their weak FIR emission. |
| In the text | |
|
Fig. 7. Left panel: Venn diagram showing the breakdown of the 24 VLBI-selected AGN which can be evaluated using the D12 IR wedge, X-ray, and q100 radio excess AGN classification schemes. The combination of radio excess, IR and X-ray AGN classifies all VLBI-selected AGN but crucially no one classification technique can classify all VLBI-selected AGN. Right panel: same 24 VLBI selected AGN in the IRAC colour–colour space with the D12 wedge overlaid. All VLBI AGN in the wedge show radio-excess and X-ray signatures. |
| In the text | |
|
Fig. 8. Stacked and smoothed X-ray images of the ten X-ray non-detections in the full (0.5–7 keV; left), soft (0.5–2 keV; centre) and hard (2–7 keV; right). Each panel is approximately 40″ × 40″ in size. The blue solid circle with radius of 5 pixels ( |
| In the text | |
|
Fig. A.1. 1.5 GHz VLA observations of J123656+615659 showing a classical FR-I morphology. The units are in μJy beam−1 |
| In the text | |
|
Fig. A.2. HST F160W imaging of the host galaxy of J123642+621545, a variable VLBI-selected source. This was detected in the 2004 Global VLBI observations (Chi et al. 2013), but not in the 2014 observation presented in this paper. The quiescent radio emission is consistent with star-formation, that could indicate a nuclear starburst being present or low-luminosity AGN jet emission. |
| In the text | |
Current usage metrics show cumulative count of Article Views (full-text article views including HTML views, PDF and ePub downloads, according to the available data) and Abstracts Views on Vision4Press platform.
Data correspond to usage on the plateform after 2015. The current usage metrics is available 48-96 hours after online publication and is updated daily on week days.
Initial download of the metrics may take a while.