Fig. 5
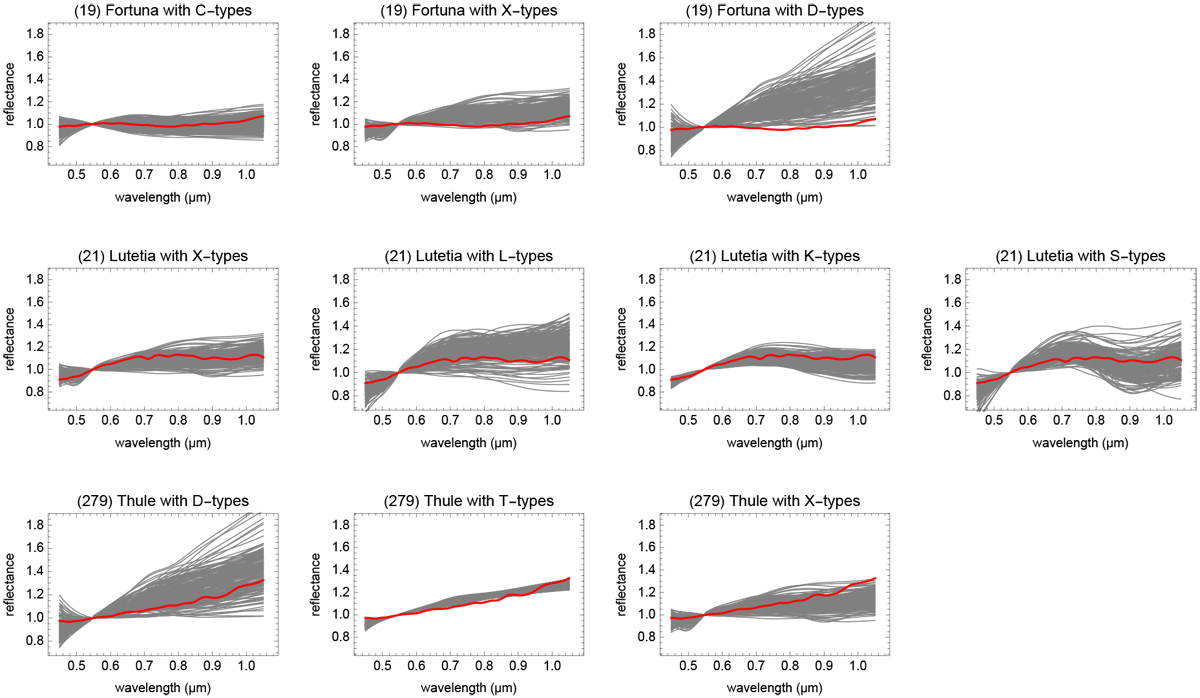
Comparison of the spectra of (19) Fortuna, (21) Lutetia, and (279) Thule to the spectra of the simulated samples in their predicted classes. Top row: Fortuna with the samples from the C, X, and D classes. Middle row: Lutetia with the samples from the X, L, K, and S classes. Bottom row: Thule with the samples from the D, T, and X classes. The red lines are thespectra of the real asteroids, while the gray lines show the synthesized samples in the training data.
Current usage metrics show cumulative count of Article Views (full-text article views including HTML views, PDF and ePub downloads, according to the available data) and Abstracts Views on Vision4Press platform.
Data correspond to usage on the plateform after 2015. The current usage metrics is available 48-96 hours after online publication and is updated daily on week days.
Initial download of the metrics may take a while.