Fig. 8.
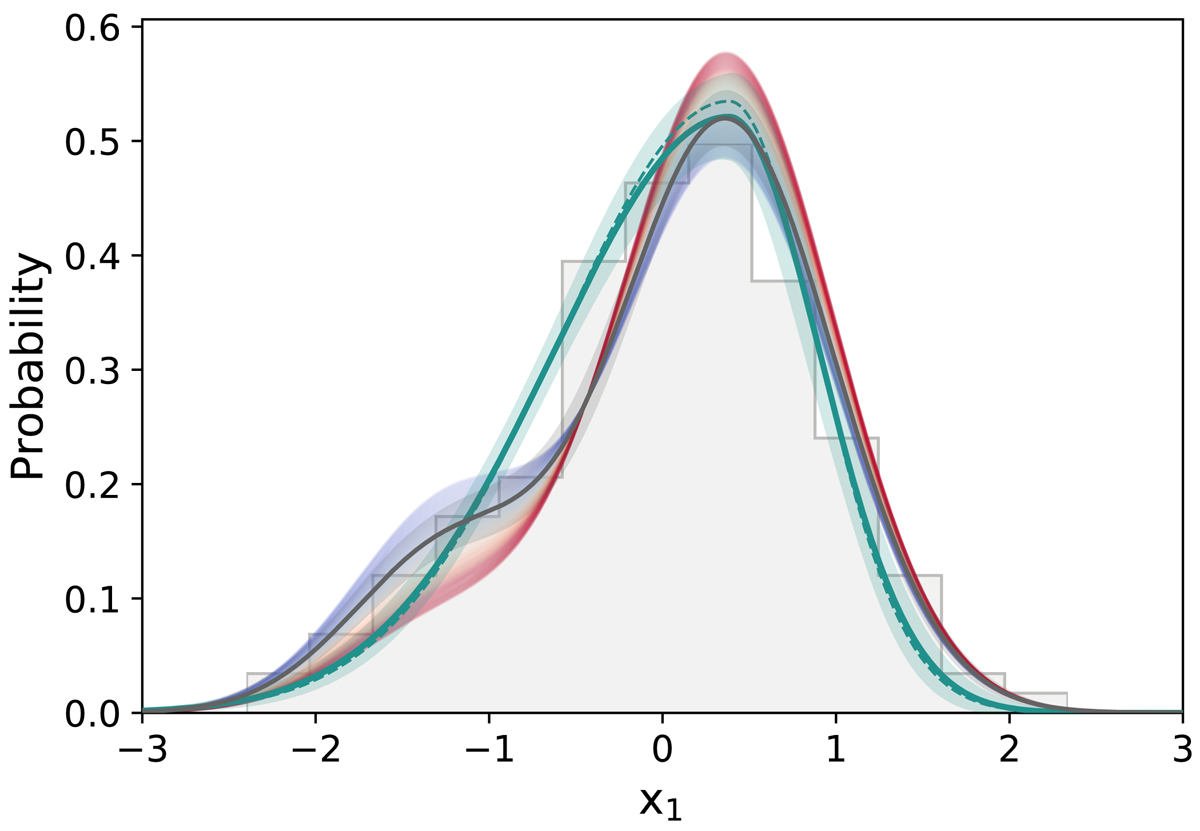
Distribution of the PS1 SN Ia SALT2.4 stretch (x1) after the fiducial redshift limit cut (gray histogram). This distribution is supposed to be a random draw from the underlying stretch distribution. The green lines show the BBC model of this underlying distribution (asymmetric Gaussian). The full line (band) is our best fit (its error); the dashed line shows the Scolnic et al. (2018) result. The black line (band) shows our best-fit base modeling (its error, see Table 2) that includes redshift drift. For illustration, we show (colored from blue to red with increasing redshifts) the evolution of the underlying stretch distribution as a function of redshift for the redshift range covered by PS1 data.
Current usage metrics show cumulative count of Article Views (full-text article views including HTML views, PDF and ePub downloads, according to the available data) and Abstracts Views on Vision4Press platform.
Data correspond to usage on the plateform after 2015. The current usage metrics is available 48-96 hours after online publication and is updated daily on week days.
Initial download of the metrics may take a while.