Fig. 7.
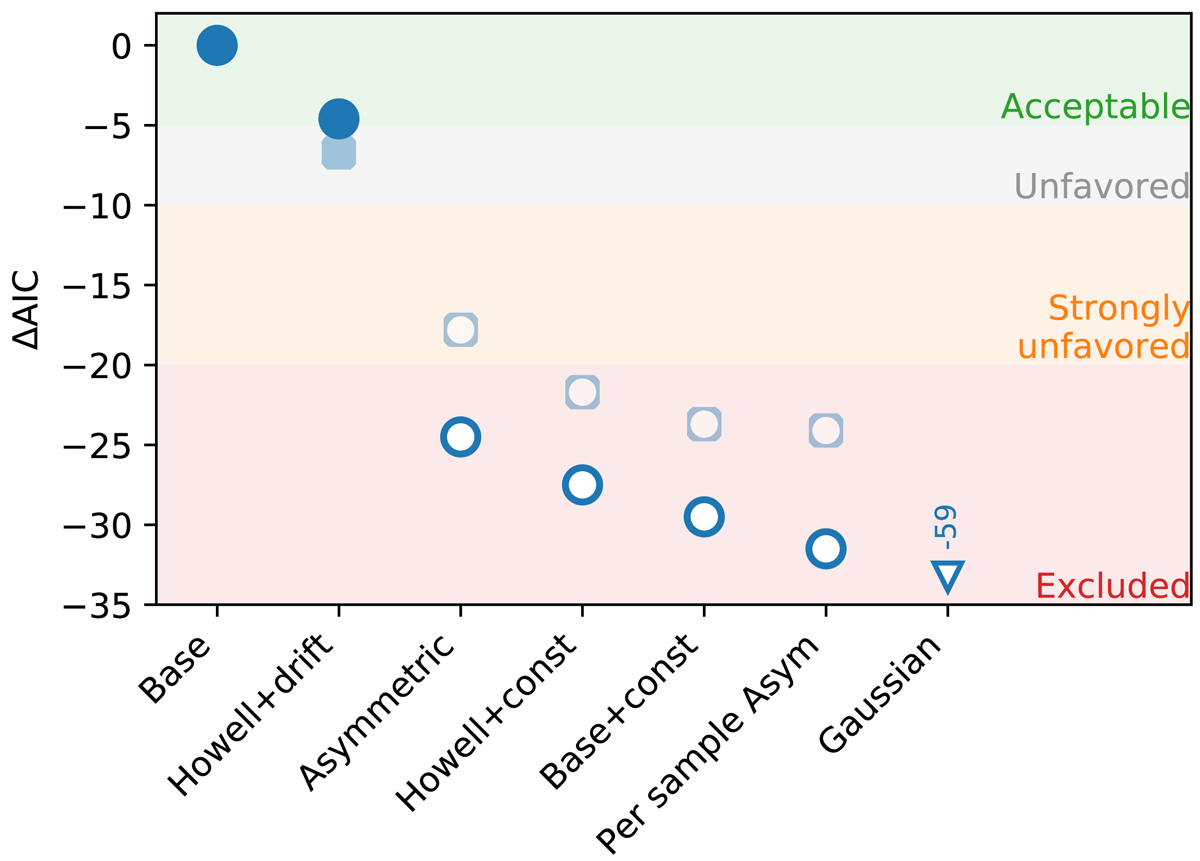
ΔAIC between base model (reference) and other models (see Table 3). Full and open blue markers correspond to models with and without redshift drift, respectively. Light markers show the results when the analysis is performed on the conservative sample rather than the fiducial one. Color bands illustrate the validity of the models, from acceptable (ΔAIC > −5) to excluded (ΔAIC < −20), see text. According to the AIC, all nondrifting models (open symbols) are excluded as a poorer representation of the data than the base (drifting) model.
Current usage metrics show cumulative count of Article Views (full-text article views including HTML views, PDF and ePub downloads, according to the available data) and Abstracts Views on Vision4Press platform.
Data correspond to usage on the plateform after 2015. The current usage metrics is available 48-96 hours after online publication and is updated daily on week days.
Initial download of the metrics may take a while.