Fig. 6.
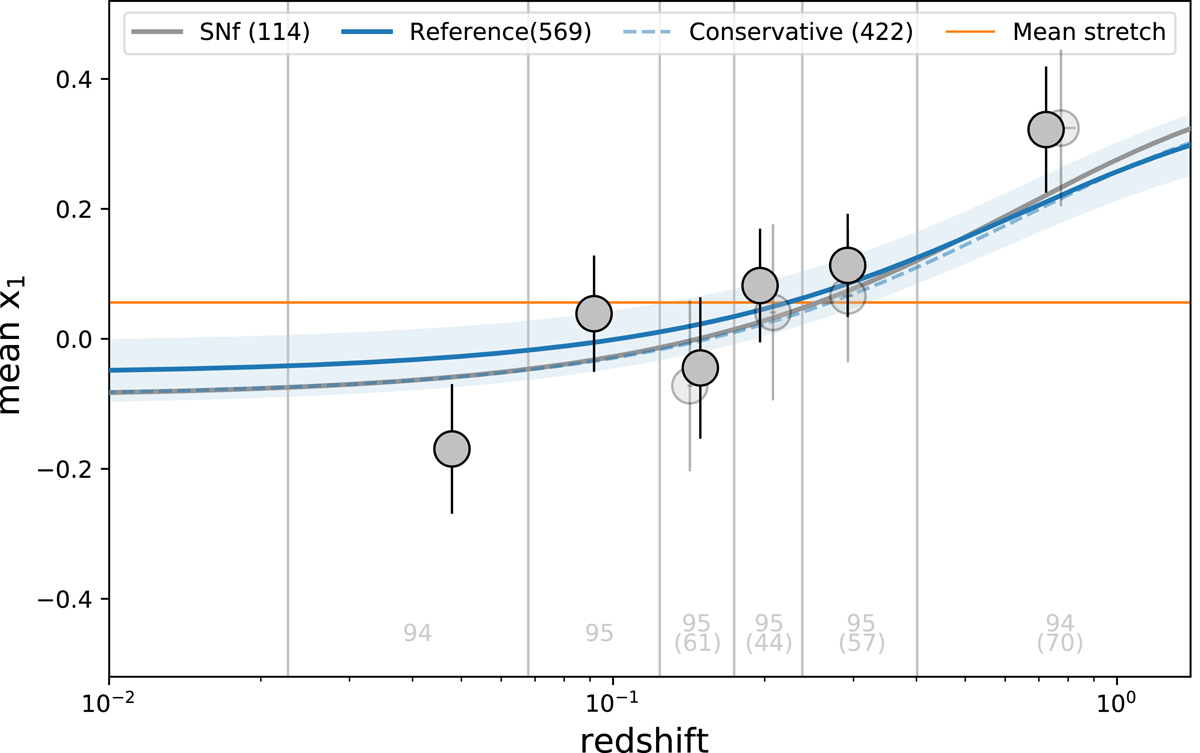
Evolution of the mean SN SALT2.4 stretch (x1) as a function of redshift. Markers show the stretch plain mean (the error is estimated from the scatter) measured in redshift bins of equal sample size, indicated in light gray at the bottom of each redshift bin. Full and light markers are used when the fiducial or conservative samples are considered, respectively. The horizontal orange line represents the mean stretch for the nonevolving Gaussian model (last line of Table 3) on the fiducial sample. Best fits of our base drifting model are shown as blue, dashed blue, and gray when fitted on the fiducial sample, the conservative sample, or the SNfactory dataset only, respectively; all are compatible. The light blue band illustrates the amplitude of the error (including covariance) of the best-fit model when considering the fiducial dataset.
Current usage metrics show cumulative count of Article Views (full-text article views including HTML views, PDF and ePub downloads, according to the available data) and Abstracts Views on Vision4Press platform.
Data correspond to usage on the plateform after 2015. The current usage metrics is available 48-96 hours after online publication and is updated daily on week days.
Initial download of the metrics may take a while.